Stop Reacting, Start Preventing: 3 Ways to Detect Data Quality Issues
Stop Reacting, Start Preventing: 3 Ways to Detect Data Quality Issues
Stop Reacting, Start Preventing: 3 Ways to Detect Data Quality Issues

Mathisse De Strooper
Mathisse De Strooper
Director of Customer Engineering at Soda
Director of Customer Engineering at Soda
Table of Contents
Data quality issues can surface anywhere; sometimes, we don’t know what they are, where they occur, or when they might emerge. This makes our fixes reactive, fixing problems only after complaints.
Instead of constantly tracing lineage and applying downstream fixes, we could always take a step back and focus on early detection. After all, understanding the problem is the first step toward solving it.
Although we can't predict every possible data quality issue, we do know where to look and how to investigate. In general, data quality problems can be discovered through three methods:
Pipeline Development – Issues spotted during pipeline testing.
Pre-Defined Metrics – Known issues tracked by specific quality checks or thresholds.
Hidden Anomalies – Unexpected issues that standard measurements don't cover but can be found with anomaly detection.
These three angles, however, do not suggest one is better than the other. In fact, they are all important because each one focuses on a different aspect of data quality, helping us detect issues as early as possible and as comprehensively as possible.
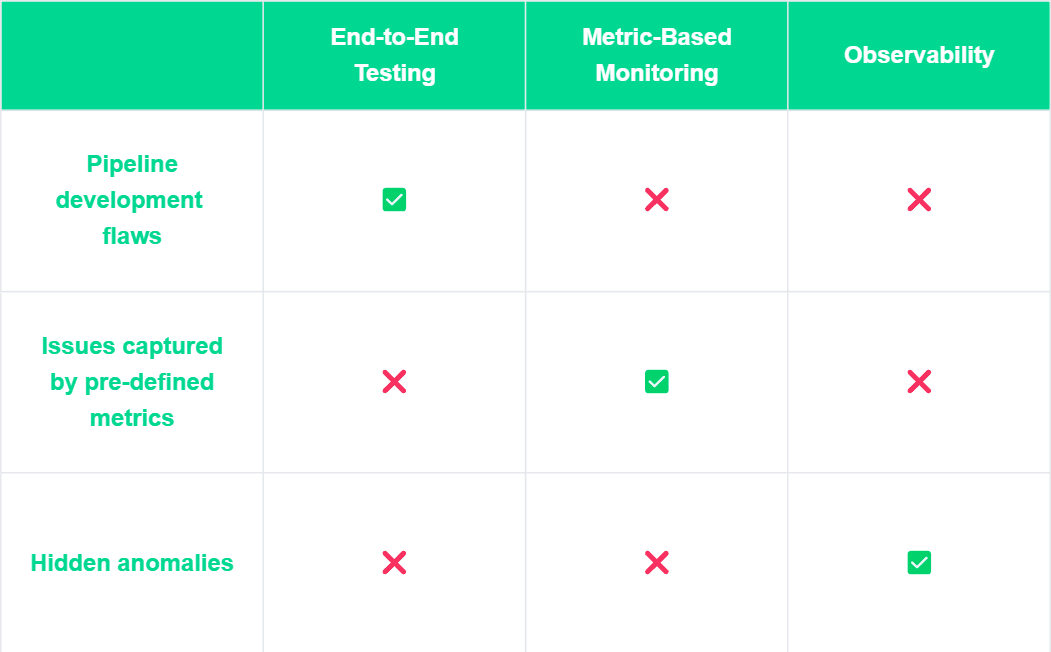
Common causes of data quality issues and their detection methods.
End-to-end data testing during development helps identify issues early, preventing downstream problems. Metric-based monitoring ensures consistency by detecting issues based on predefined metrics, while observability uncovers hidden anomalies that traditional monitoring might miss.
In this blog, we’ll explore how to effectively detect data quality issues in these areas using Soda, with hands-on examples that showcase how these methods work together to create proactive data quality solutions for better data governance.
Before we dive in, let’s go over some necessary preparations.
This blog was created with previous versions of Soda Core and Soda Cloud, so there might be minor code syntax and UI path differences. If you have any questions, refer to https://docs.soda.io/ |
|---|
Writing Data Quality Checks that Everyone Wants to Read
We can't expect everyone on the team to understand SQL, but does that mean data quality should be owned only by those who do? Absolutely not. Ensuring good data quality is a team effort, and it’s crucial that everyone stays on the same page.
That’s why we need a straightforward approach to defining data expectations so everyone can understand them. Soda Check Language (SodaCL) fits the role perfectly: it’s simple enough for less technical team members to grasp, yet powerful enough for developers to customize.
Here’s a quick example of how to write a data quality check for a datasetdim_customer. In the following sections, we’ll see how these checks come into play in various workflows.
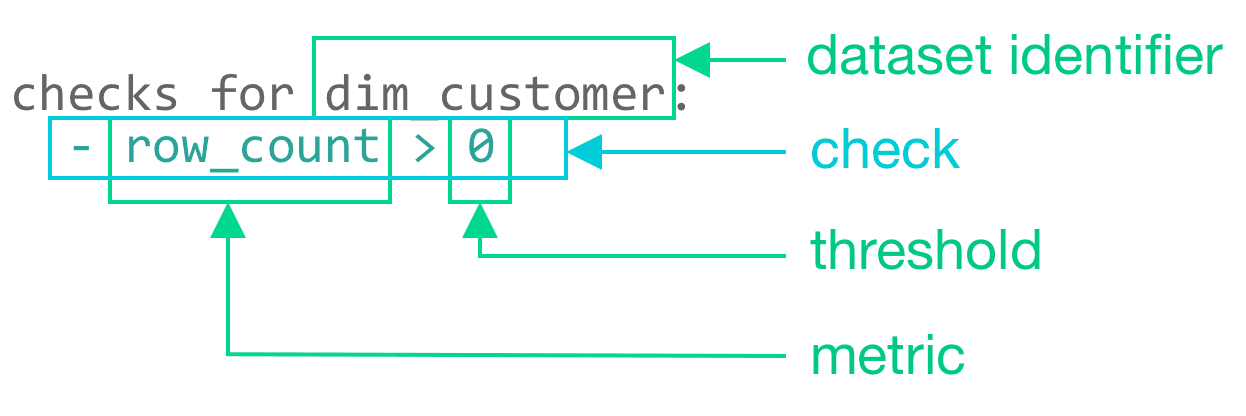
Structure of a simple SodaCL check for 'row count'
End-to-End Data Quality Testing with Soda
In this section, we will discover how to validate and test data in the data pipeline before it impacts production with Soda data quality checks.
Data flows from one stage to another in a data pipeline. End-to-end (E2E) testing is all about making sure each stage in the data pipeline is reliable, from the moment data arrives in the warehouse to when it’s delivered to our downstream users.
It's the best practice to start E2E data quality testing as early as possible! Although we can usually handle data quality problems at the source, they can be very difficult to deal with if they arise later.
Using Soda data quality checks with SodaCL at each step of the data pipeline helps ensure data quality and keeps things running well.
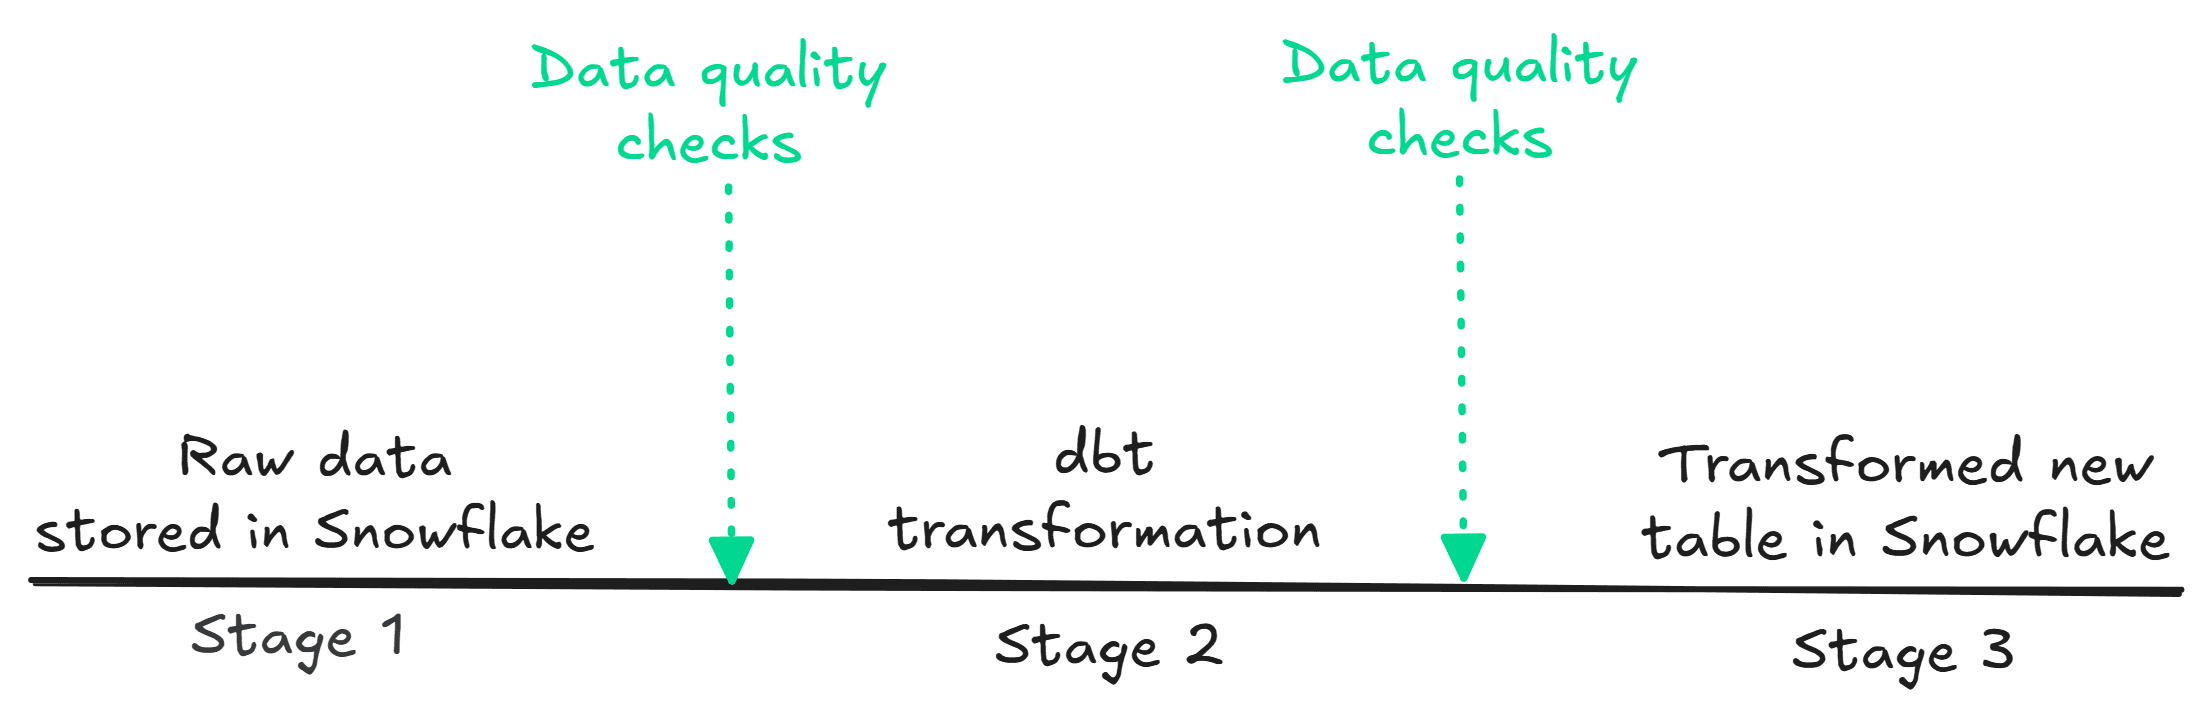
This is especially helpful when we spot data quality issues in the upstream pipeline. To show you how this works, I created a simple data pipeline with Airflow, where the data travels from the Snowflake database, gets transformed with DBT, and has Soda running data quality checks between each stage. Here is a quick overview:
Airflow DAG data pipeline with data quality checks
Just a heads up, this section is a bit technical and lengthy, so it’s great if you already know how to create a data pipeline, especially with the Airflow DAG. The demonstration will focus on implementing Soda data quality scans within the Airflow data pipeline, and it will start under the condition that Snowflake is connected and set up with Airflow on a Windows operating system.
Prerequisites
To run the Soda data quality checks in a data pipeline, we need to have the Soda Library installed, configure it to the corresponding data source, and specify what kind of checks we want to run with it.
Install Soda
Under the current project directory, in our case 'Airflow_demo', create a directory 'Soda' and make a new virtual environment.
Install the appropriate Soda Library in the virtual environment based on the data source we want to work with. Since I'm using Snowflake, I installed Soda with
pip install -i https://pypi.cloud.soda.io soda-snowflake. If you're using a different operating system or need to set up a different data source, please refer to this installation guide accordingly.
The self-serve account creation for Soda Cloud is temporarily paused as we're preparing the general availability of several major updates. If you want to try Soda Cloud in the meantime, please schedule a call with our team of experts, discuss your use case, and get started. |
Configure Data Source and Soda Cloud
When Soda needs to run data quality checks in Airflow, it looks for a configuration.yml file to find the data source, along with another checks.yml file that contains the data quality checks you want to perform. Make sure the two files were prepared and saved in a similar structure as follows:
In the configuration.yml file, add the Snowflake account details and data source information like this, with Soda Cloud account details at the end:
data_source snowflake_db:
  type: snowflake
  connection:
    username: luca
    password: secret
    account: YOUR_SNOW_FLAKE_ACCOUNT
    database: ECOMMERCE_CUSTOMER_SATISFACTION
    warehouse: COMPUTE_WH
    role: ACCOUNTADMIN
  schema: CUSTOMER

  soda_cloud:
  host: cloud.soda.io
  api_key_id: secret
  api_key_secret
Specify data quality checks with SodaCL
In the checks.yml file, we’ll write data quality checks that Soda will use later to run on our dataset. Writing checks is really simple, like this:
checks for CUSTOMER_SATISFACTION:
  - duplicate_count(ORDER_ID) = 0:
       name: No duplicate ORDER ID
  - missing_count(ORDER_ID) = 0:
       name: No missing ORDER ID
  - schema:
       warn:
         when schema changes: any
       name
I've included three checks for my dataset CUSTOMER_SATISFACTION : a duplication check, missing value counts for the ORDER_ID column, and a schema check that will alert us if there are any changes to the columns in the future. You can also discover more checks or create your own by following the instructions in this documentation.
Lastly, in the command line, let's type in soda test-connection -d snowflake_db -c configuration.yml to start a test and see if Soda is connected to my data source and running smoothly.
Having all the configurations set in place, our next step is to integrate Soda into the Airflow pipeline.
Define a Soda Scan in DAG
To use Soda with our Airflow data pipeline, we need to start a Soda Scan workflow in an Airflow DAG. In a Soda Scan workflow, Soda will find the data source, get the access credentials (from configuration.yml), decide which checks (from checks.yml) to perform on the dataset and then provide the complete scan results.
Here is how we can achieve this with two main steps: first, create a python function for the Soda Scan workflow, and second, create a new DAG file and call this function with the @task decorator.
Step 1: Create a check() function in a new python file check_function.py in the Soda folder to set up the Soda Scan workflow:
# Invoke Soda library
def check(scan_name, checks_subpath=None,
data_source='snowflake_db', project_root='include'):
    from soda.scan import Scan

    # Soda needs both configuration & checks files to exectue the check
    config_file = f'{project_root}/soda/configuration.yml'
    checks_path = f'{project_root}/soda/checks.yml'

    if checks_subpath:
        checks_subpath += f'/{checks_subpath}'

    scan = Scan()
    scan.set_verbose()
    scan.add_configuration_yaml_file(config_file)
    scan.set_data_source_name(data_source)
    scan.add_sodacl_yaml_files(checks_path)
    scan.set_scan_definition_name(scan_name)

    result = scan.execute()
    print(scan.get_logs_text())

    if result != 0:
        raise ValueError('Soda Scan failed'
Step 2: Create an Airflow DAG that calls the check() function as an external Python task. In the DAG file, we import and invoke the check() function like this:
# DAG file: Import the check method from check_function.py
def customer():
    @task.external_python(python='/usr/local/airflow/soda_venv/bin/python')
    def check_customer(scan_name='check_customer', checks_subpath='tables',
    data_source='snowflake_db'):
        # check_function.py from the Soda folder
        from include.soda.check_function import check

        check(scan_name, checks_subpath, data_source)

    check_customer()
Your working folder should now look like this:
airflow_demo/
├── dags/
│   ├── dag_soda.py #step 2
├── Soda/
│   ├── check_function.py #step 1
│   ├── configuration.yml
│   └── checks.yml
Pipeline Stop 1: Pre-Transformation Checks
With everything set in place, we can trigger the Airflow DAG with the Soda Scan before the data gets to the transformation stage. In this process, Soda will scan the data in Snowflake and flag anything that doesn’t meet the quality rules we’ve established. Think of this as our first line of defense, catching any obvious issues before they affect the rest of the pipeline.
Data quality checks before stage 2 transformation
As soon as the DAG was triggered, we noticed a failure warning in the log, letting us know that the missing value check for the column ORDER_ID didn’t pass. Just think about it—if those missing IDs go unnoticed, downstream analytics might miss these records, which could affect our reporting on order volumes or customer satisfaction. This really highlights how important good data quality is and makes a strong case for E2E testing. After the first check ran, we got the following warnings in the terminal:
Oops! 1 failure. 0 warnings. 0 erros. 2 pass.
The flag shows that there are missing values in the table under the column ORDER_ID. To fix this, we can access the Soda Cloud UI to get more details about the rows in this particular column:

Missing rows analysis from Soda Cloud UI
From the insight of the Failed Rows Analysis, we can find all the records that didn't pass the missing value check. This information comes in a timely manner, allowing us to fix the issue during the early stages. Consequently, since we want to ensure that all customer order feedback is reviewed and analyzed later, it also helps us avoid any issues during the transformation process.
For a quick issue resolution, we can either try to recover missing records from the source, remove these entries from the table, or raise the tolerance for missing values. For demonstration purposes, I choose to increase the tolerance thresholds and allow an additional 5% of records without the ORDER_ID in the previous checks.yml file, to show you how this would work:
- missing_percentage(ORDER_ID) = 5%:
       name
Run the DAG again, and with no surprises, we get the following notification showing in the terminal:
All is good. No failures. No warnings. No errors.
Pipeline Stop 2: dbt Transformation
Now that we have the raw data checked and validated, it's time to kick off a dbt transformation in the DAG. At this stage, dbt does its usual magic—like joining tables and applying business rules—so we can get the data ready for analytics or machine learning.
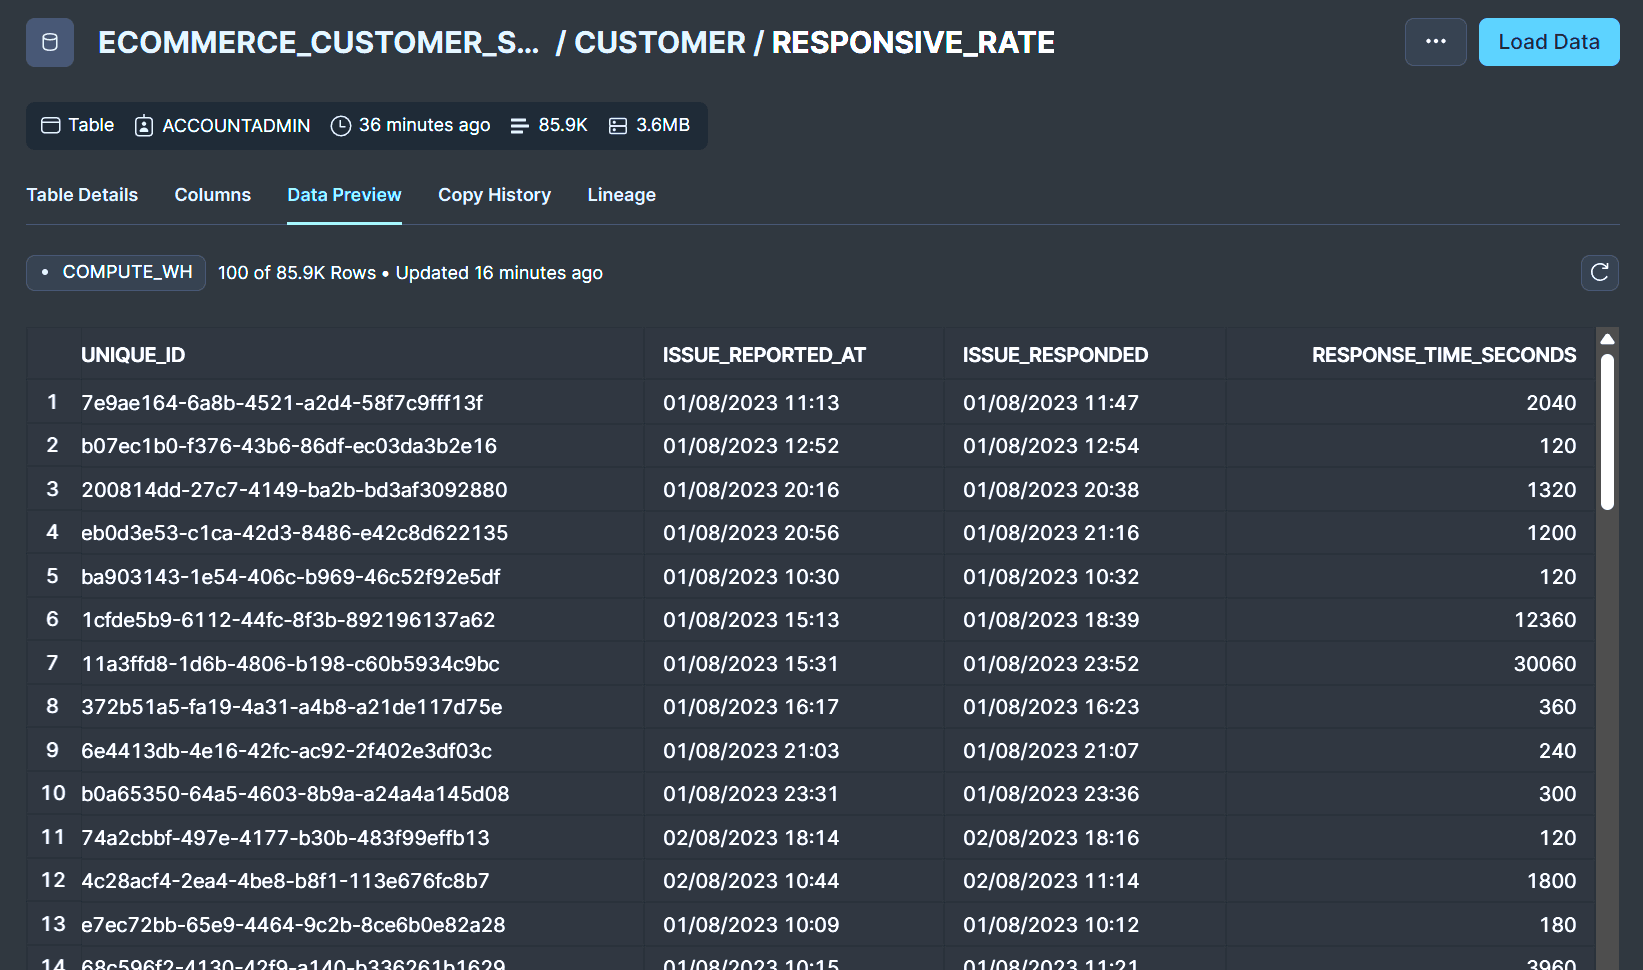
In this example, the dbt's job is to create a data model that generates a new table based on the original one. This new table RESPONSIVE_RATE should include a column RESPONSE_TIME_SECONDS to track how long it takes for customer service to respond to inquiries, measured in seconds.
I won't dive into all the details about writing dbt models and triggering the DAG, as that's not the main focus of this demo.
With the Airflow DAG triggered, the previously defined Soda scan runs again (let's not forget Soda Scan will always get triggered since it's the first part of the DAG). With no alerts this time, we can find our newly aggregated table in Snowflake!
New table Responsive_Rate generated from dbt transformation
Pipeline Stop 3: Post-Transformation Checks
Our new table looks great, but we still have some work to do. While dbt does a fantastic job, it doesn’t guarantee that our data is of high standards. There’s always a chance that something unexpected might pop up.
For example, after transformation, we end up with a new table featuring the response_time_seconds metric. But what if this leads to new data quality issues, like missing timestamps, resulting in null or invalid records?
To catch these potential issues, let's add some extra data quality checks. In the same folder called 'Soda', we can create a new check_transform.yml file, which will have specific data quality checks for this transformed table:
checks for RESPONSIVE_RATE:
  - missing_count(RESPONSE_TIME_SECONDS) = 0:
       name: No missing response time
  - schema:
       warn:
         when schema changes: any
       name
Except for regular schema checks, I also included a new missing value check for the new column RESPONSE_TIME_SECONDS After this, we can repeat the similar process (stop 1 data quality check) and add this new task to the DAG.
Now the DAG file will have a complete workflow as follows:
Soda Scan → dbt Transformation → Soda Scan
# This is our dag workflow
@dag(
    start_date=datetime(2024, 3, 1),
    schedule='@daily',
    catchup=False,
    tags=["customer pipeline"],
)

# The DAG workflow
def customer():
    # Pre-transformation Soda Scan
    @task.external_python(python='/usr/local/airflow/soda_venv/bin/python')
    def check_customer(scan_name='check_customer', checks_subpath='tables',
    data_source='snowflake_db'):
        from include.soda.check_function import check

        check(scan_name, checks_subpath, data_source)

    # dbt Transformation
    transform = DbtTaskGroup(
        group_id='transform',
        project_config=DBT_PROJECT_CONFIG,
        profile_config=DBT_CONFIG,
        render_config=RenderConfig(
            load_method=LoadMode.DBT_LS,
            select=['path:models/transform']
        )
    )

    # Post-transformation Soda Scan
    @task.external_python(python='/usr/local/airflow/soda_venv/bin/python')
    def check_transform(scan_name='response_rate_check',
    checks_subpath='tables', data_source='snowflake_db'):
        from include.soda.check_function import check

        check(scan_name, checks_subpath, data_source)
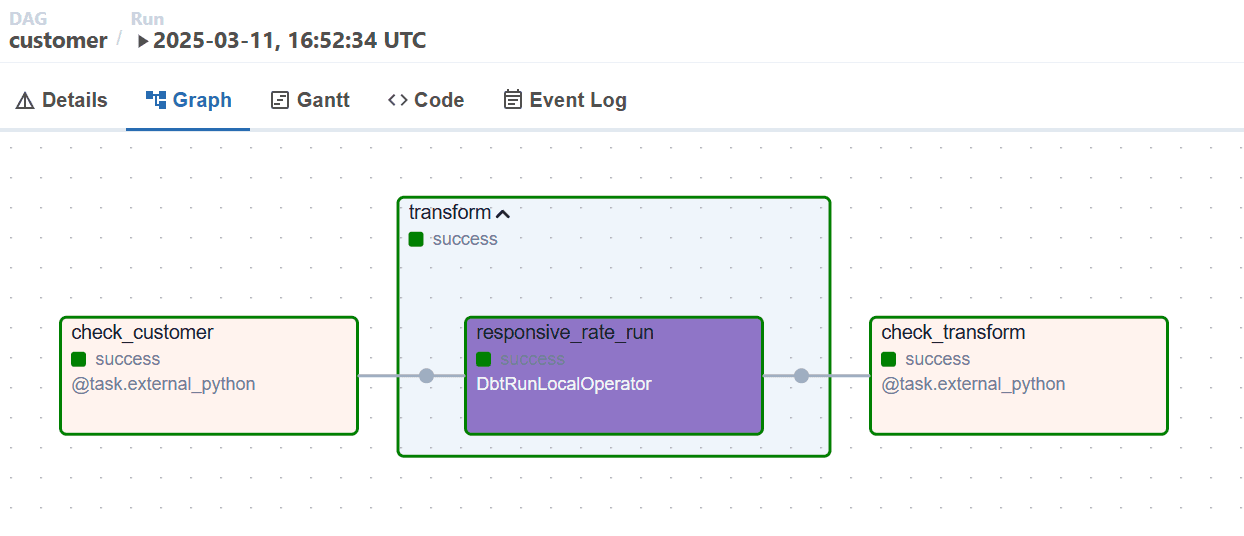
Finally, the DAG is triggered again, and what we will have is this lovely DAG graph in Airflow showing that everything was executed successfully! 🎉
DAG execution workflow
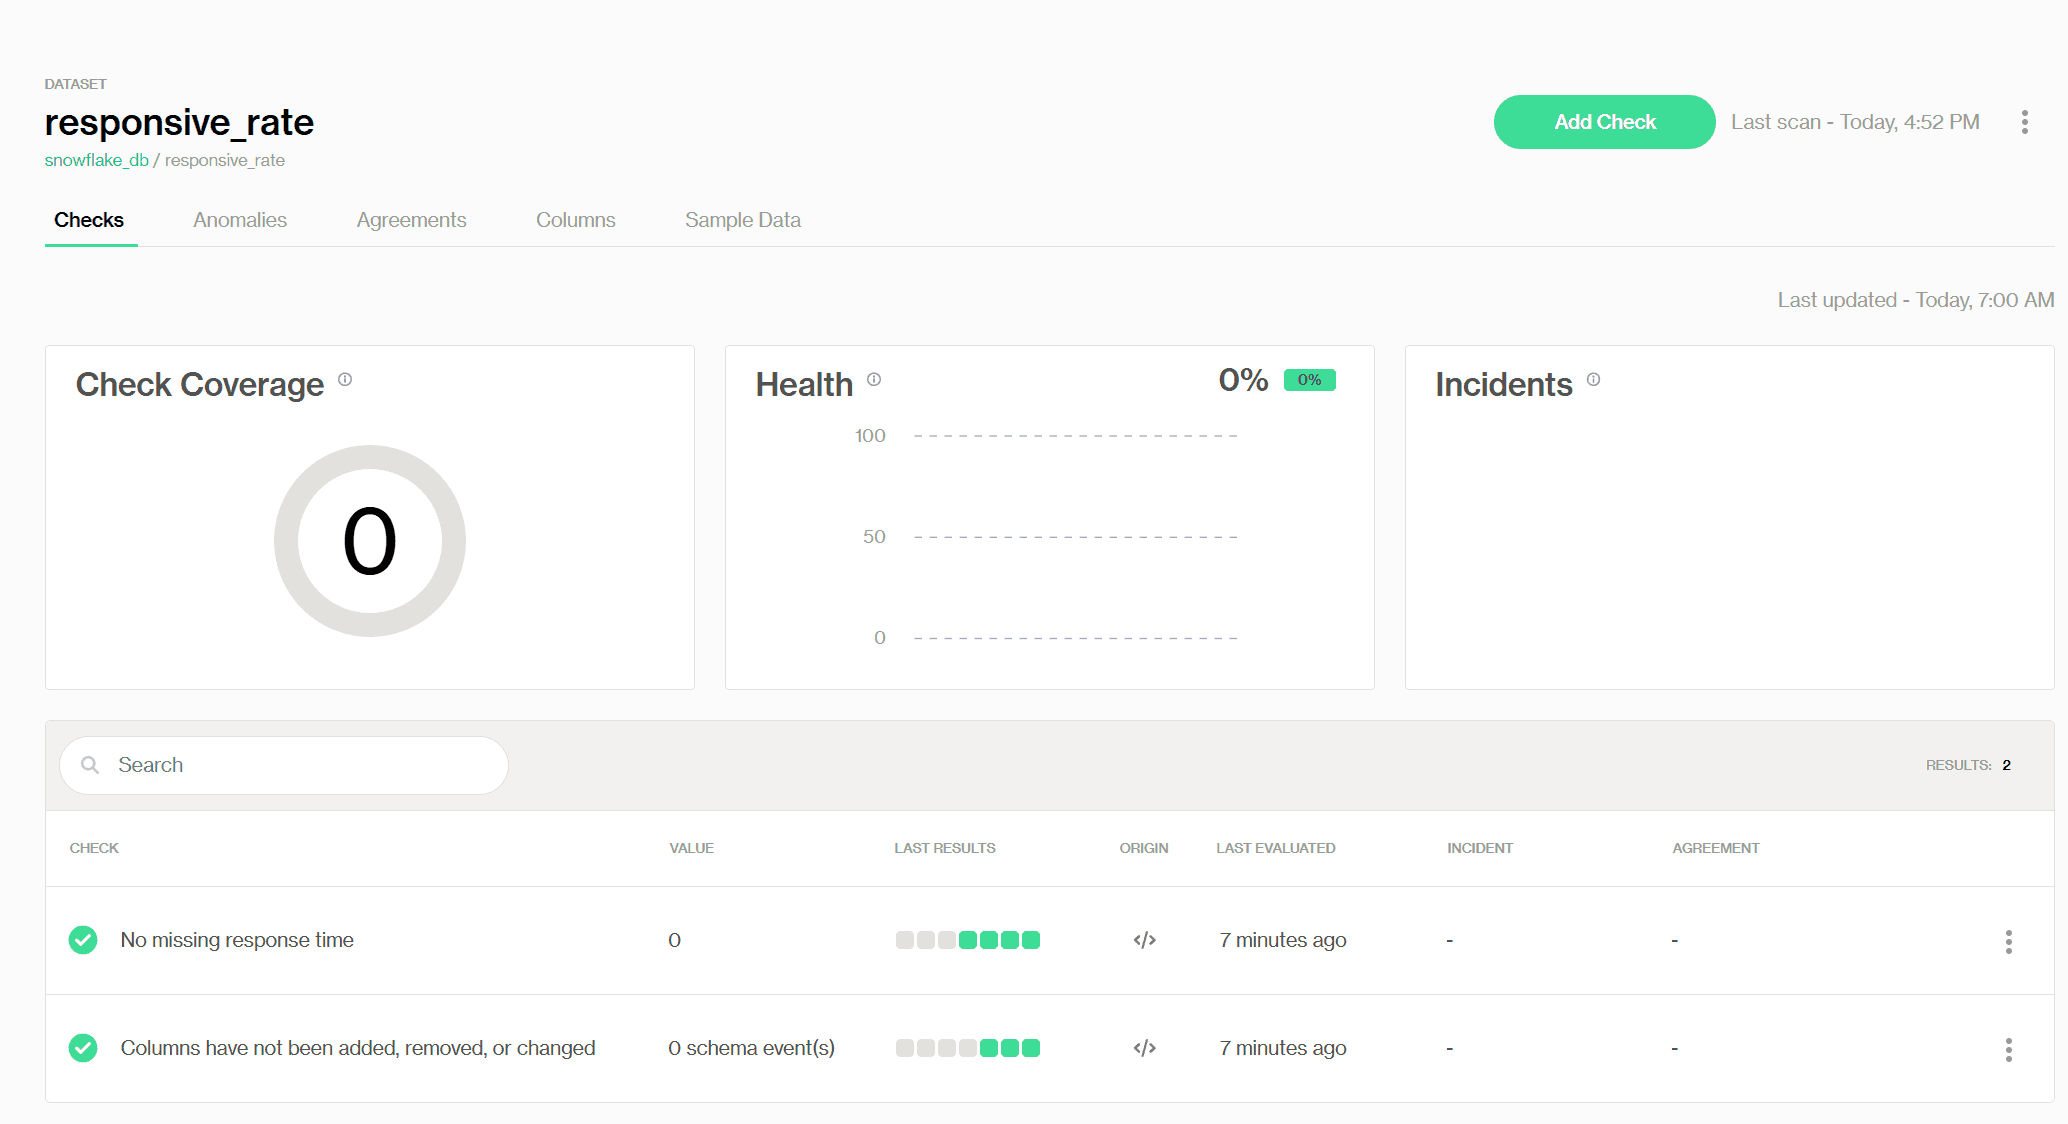
Additionally, we can explore the scan results from the new table in the Soda UI in a holistic view, where our colleagues can also gain access. I won't be explaining the details here, as that's the topic of the next section :)
Soda scan results for the new dataset in Soda Cloud UI
Once everything is checked, the data is ready to use, whether it’s for a dashboard in a BI tool or for training a machine learning model. By the time it gets to these systems, we have done several checks, drastically reducing surprises and last-minute issues.
Monitoring Data Quality in Action
While E2E testing is great for making sure our data pipeline stays strong during development and changes, data quality issues can still sneak up on us at any time. It’s important to catch these issues early and fix them before they cause any trouble downstream.
After all, data quality requires long-term assurance.
Soda monitors data quality with rules, thresholds, and dashboards—like the ones we are about to explore in Soda Cloud UI—to measure data quality health. If a metric goes beyond a pre-defined threshold (for example, if the number of processed rows drops below a known baseline) or a simple schema change, we’ll receive an alert right away.
Metrics, Thresholds, and Alert Strategy
Remember the new dataset responsive_rate that we generated with the DAG before? It provides new insights into how long it usually takes for a customer representative to respond to and resolve a customer's issue.
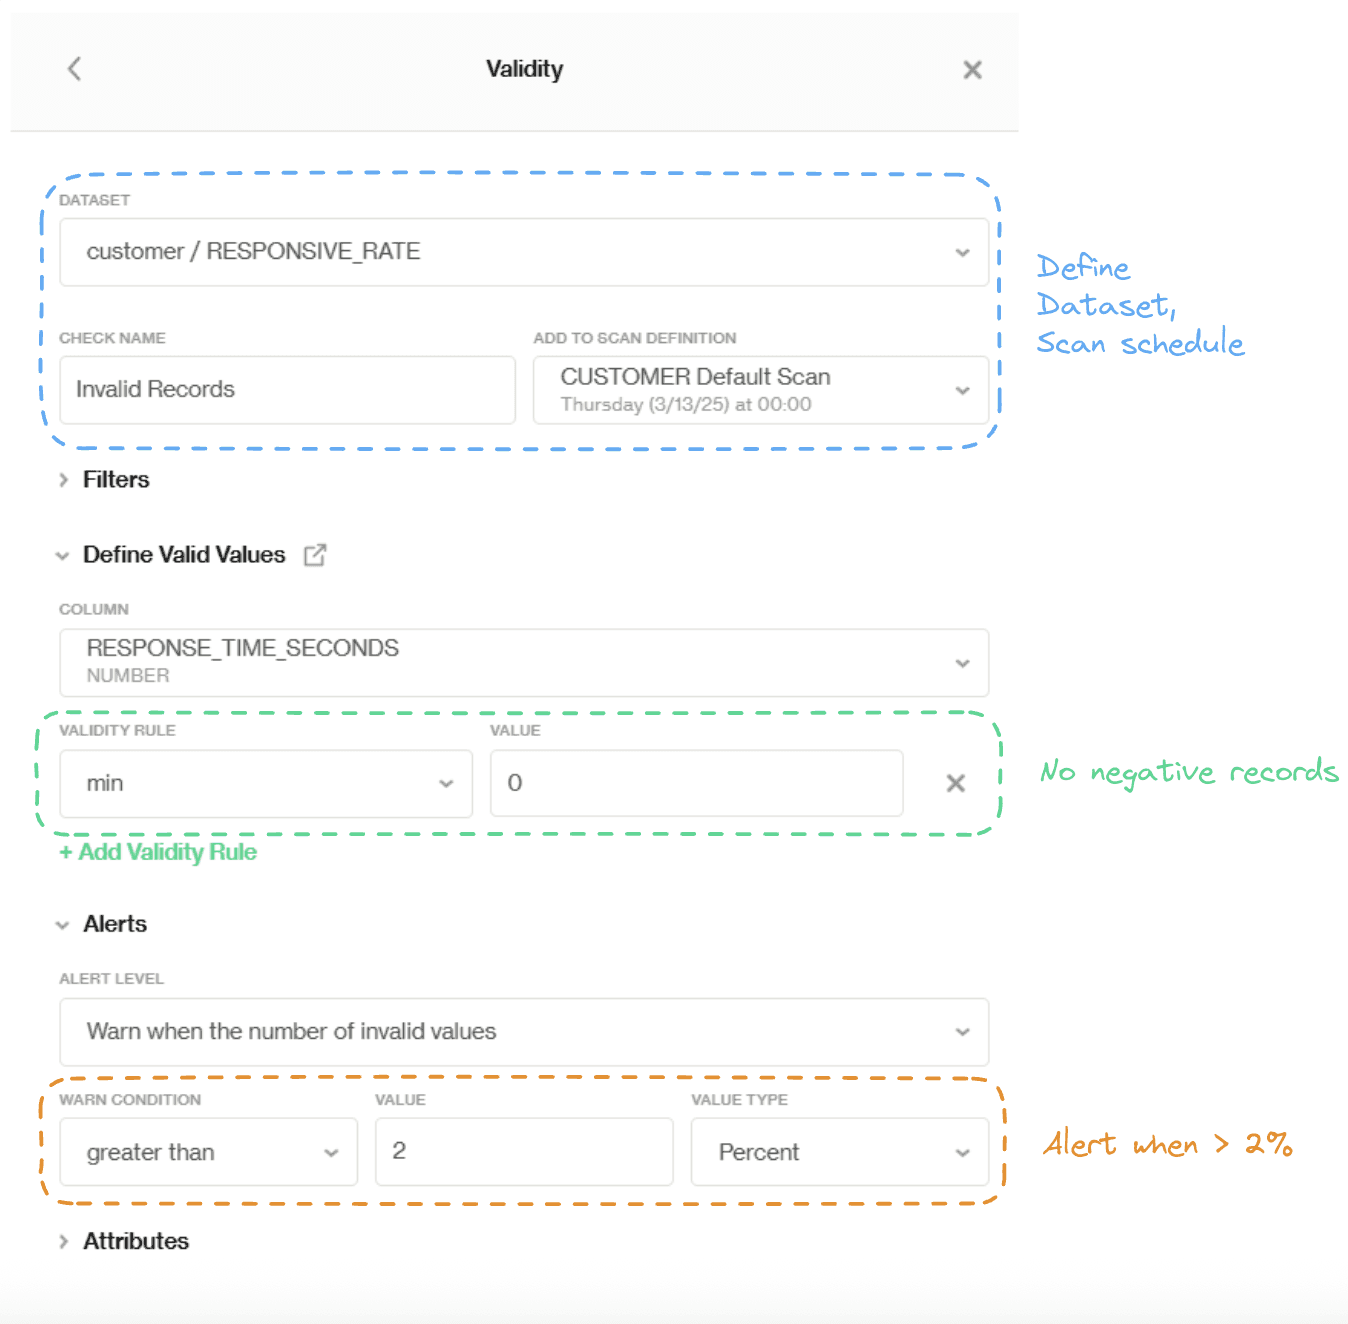
From an analytical perspective, it would be beneficial to ensure that no customer representative's response time to customers is negative. This is a new data quality metric we intend to add now, but it was not included during our end-to-end testing.
Additionally, we’d love to receive an alert when the total number of these invalid records exceeds 2%. Let’s explore how we can achieve this in Soda dashboard!
In Soda Cloud UI, if we locate the dataset dashboard, we will be able to find several Soda pre-defined checks, as well as customizable SQL checks.
Adding pre-defined Validity check
Conveniently, we can set up a validity rule (shown as follows) with the pre-defined check called 'Validity', in here, we set the validity value min to 0—so anything negative gets flagged as an invalid value. Additionally, we change our invalid tolerance level and get alerted when the total number of invalid values reaches 2% of the total records. This way, the data owner can fix the errors in time to prevent any further issues down the line.
Adding pre-defined Validity check
Once we’ve set up all the checks, with thresholds and alerts ready to go, we can monitor data quality health on all the datasets with dashboards, where we will see logs, alerts, and trends all in one place, with no need to guess.
Soda Cloud UI offers three dashboards with three levels of granularity:
Main Dashboard monitors the overall condition of the data source
Dataset Dashboard monitors a specific dataset
Metric Dashboard for each data quality check.
Let’s check out these dashboards together, one by one.
Main Dashboard
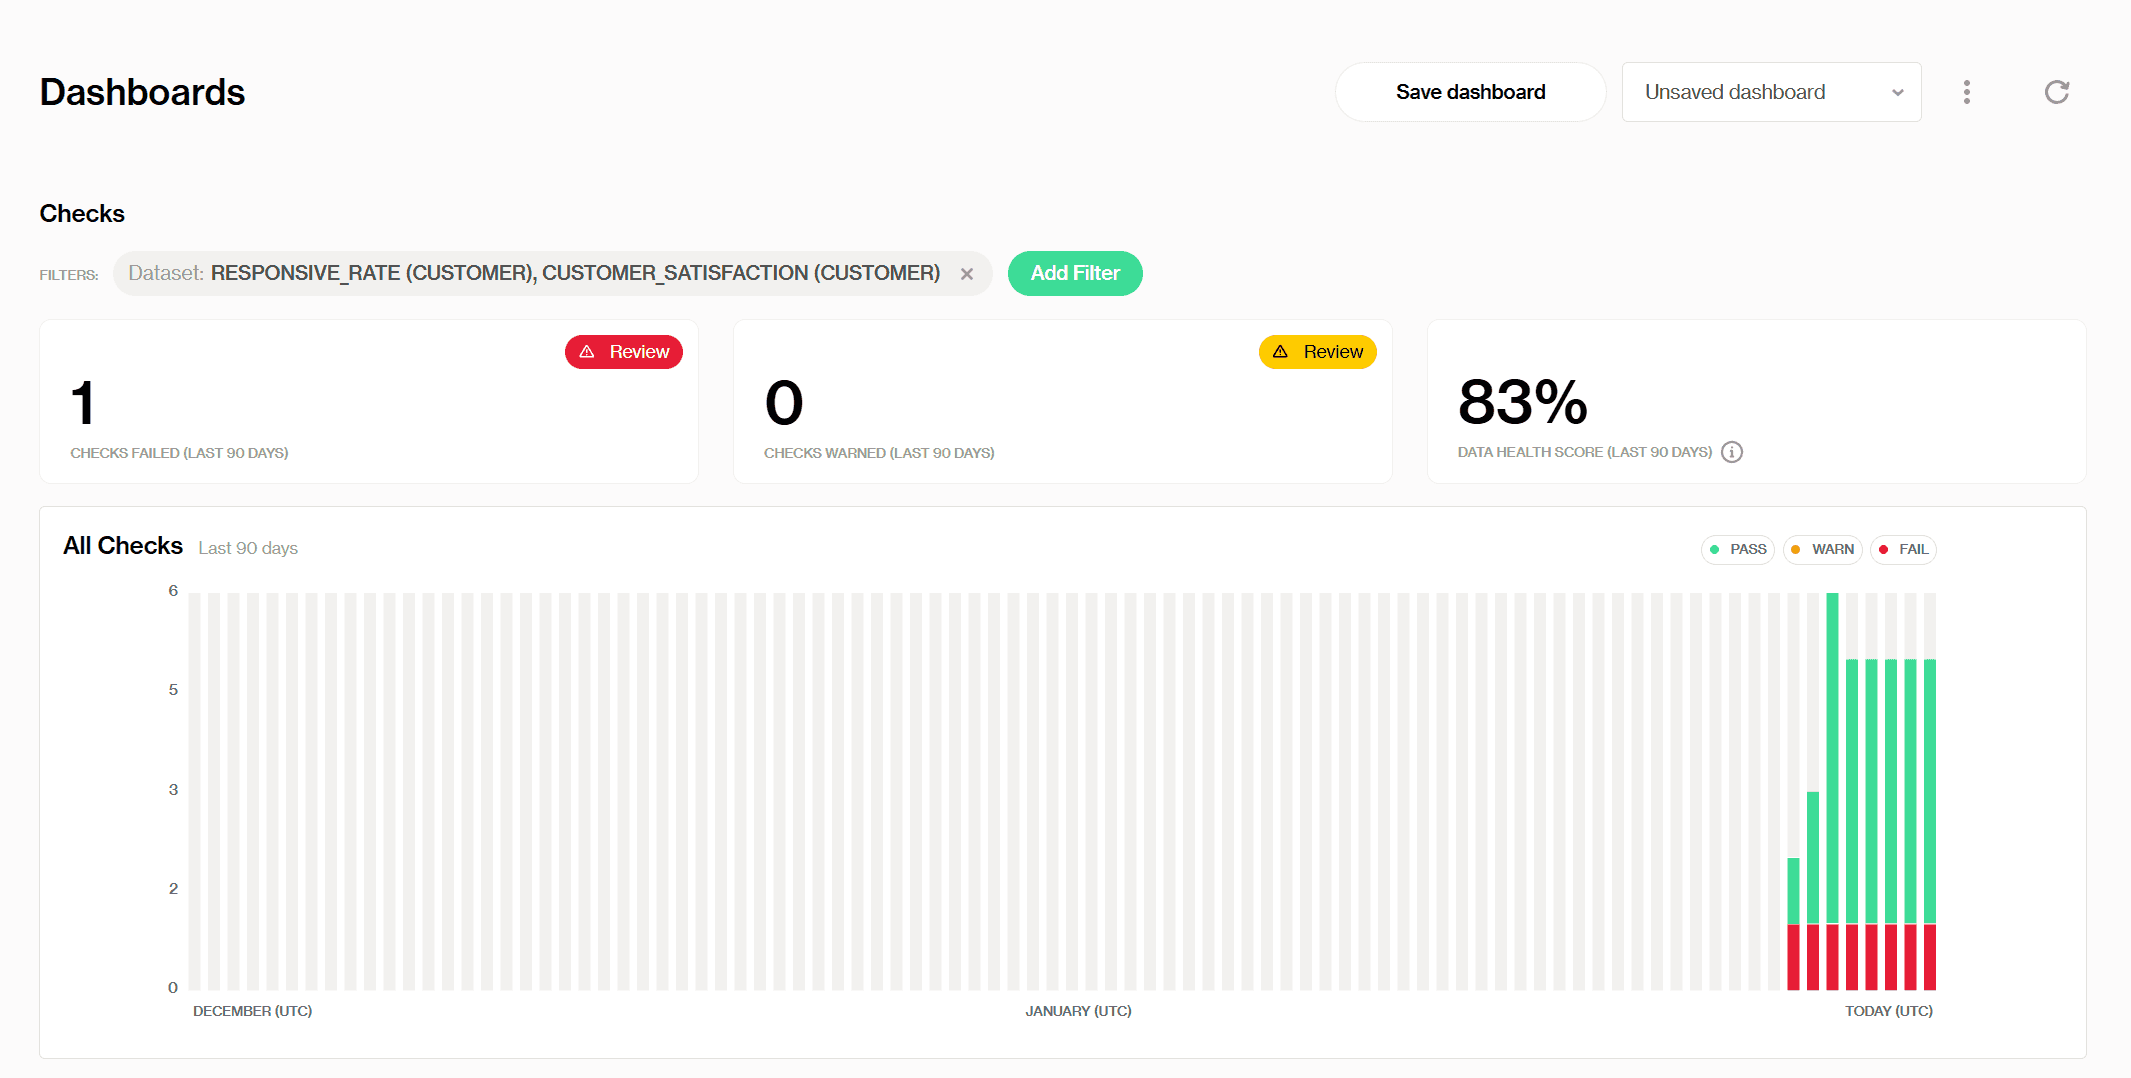
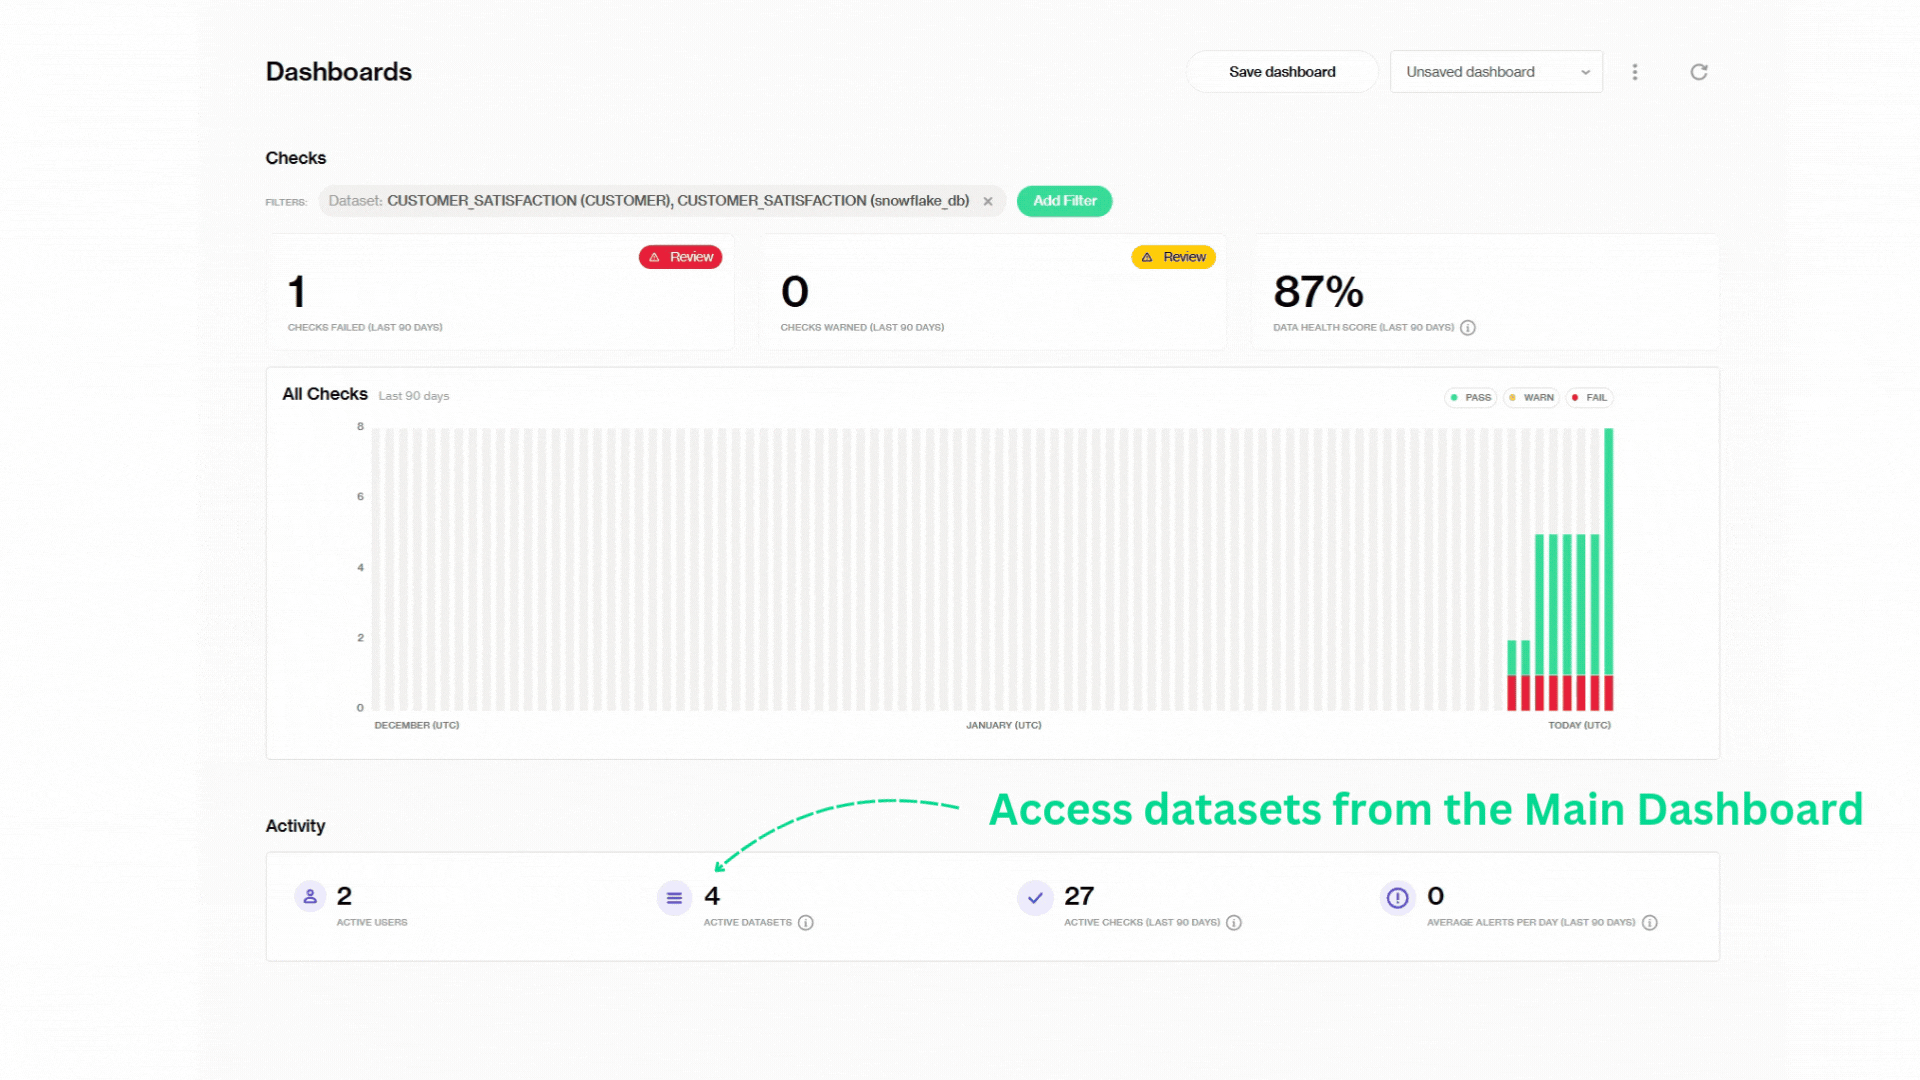
This dashboard is our bird’s-eye view of all checks across one or more datasets. At a glance, we can see we have 1 check that has failed in the last 90 days, 0 checks that require attention, and an overall 83% data health score.
Adding pre-defined Validity check
Notice how each vertical bar represents a check run at a given time:
green for passed, red for failed, and yellow for warnings. If you hover your mouse over the bars, you can find out how many checks are passing, require attention, or are failing, and need immediate issue resolution. Like the one here:
Also, the filters option helps us group specific datasets and lets us track all the checks that ran on them all together. Here, the main dashboard shows all the metrics from combining the two datasets that we mentioned before, the original dataset CUSTOMER_SATISFACTION, and RESPONSIVE_RATE.
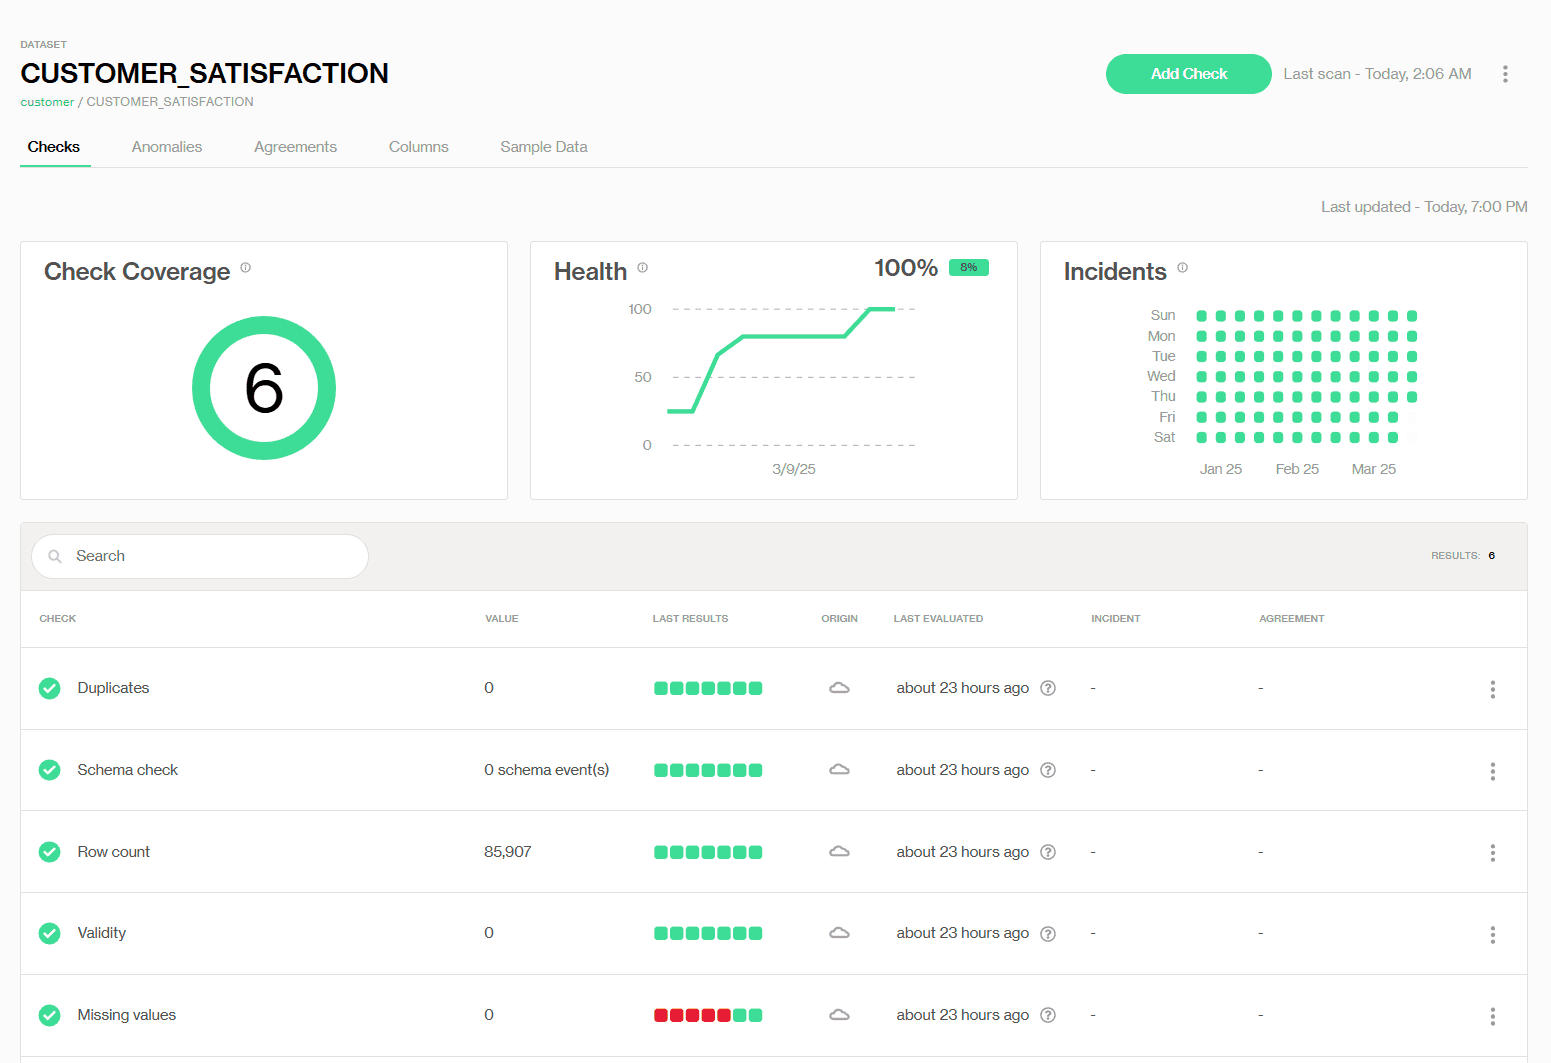
Dataset Dashboard
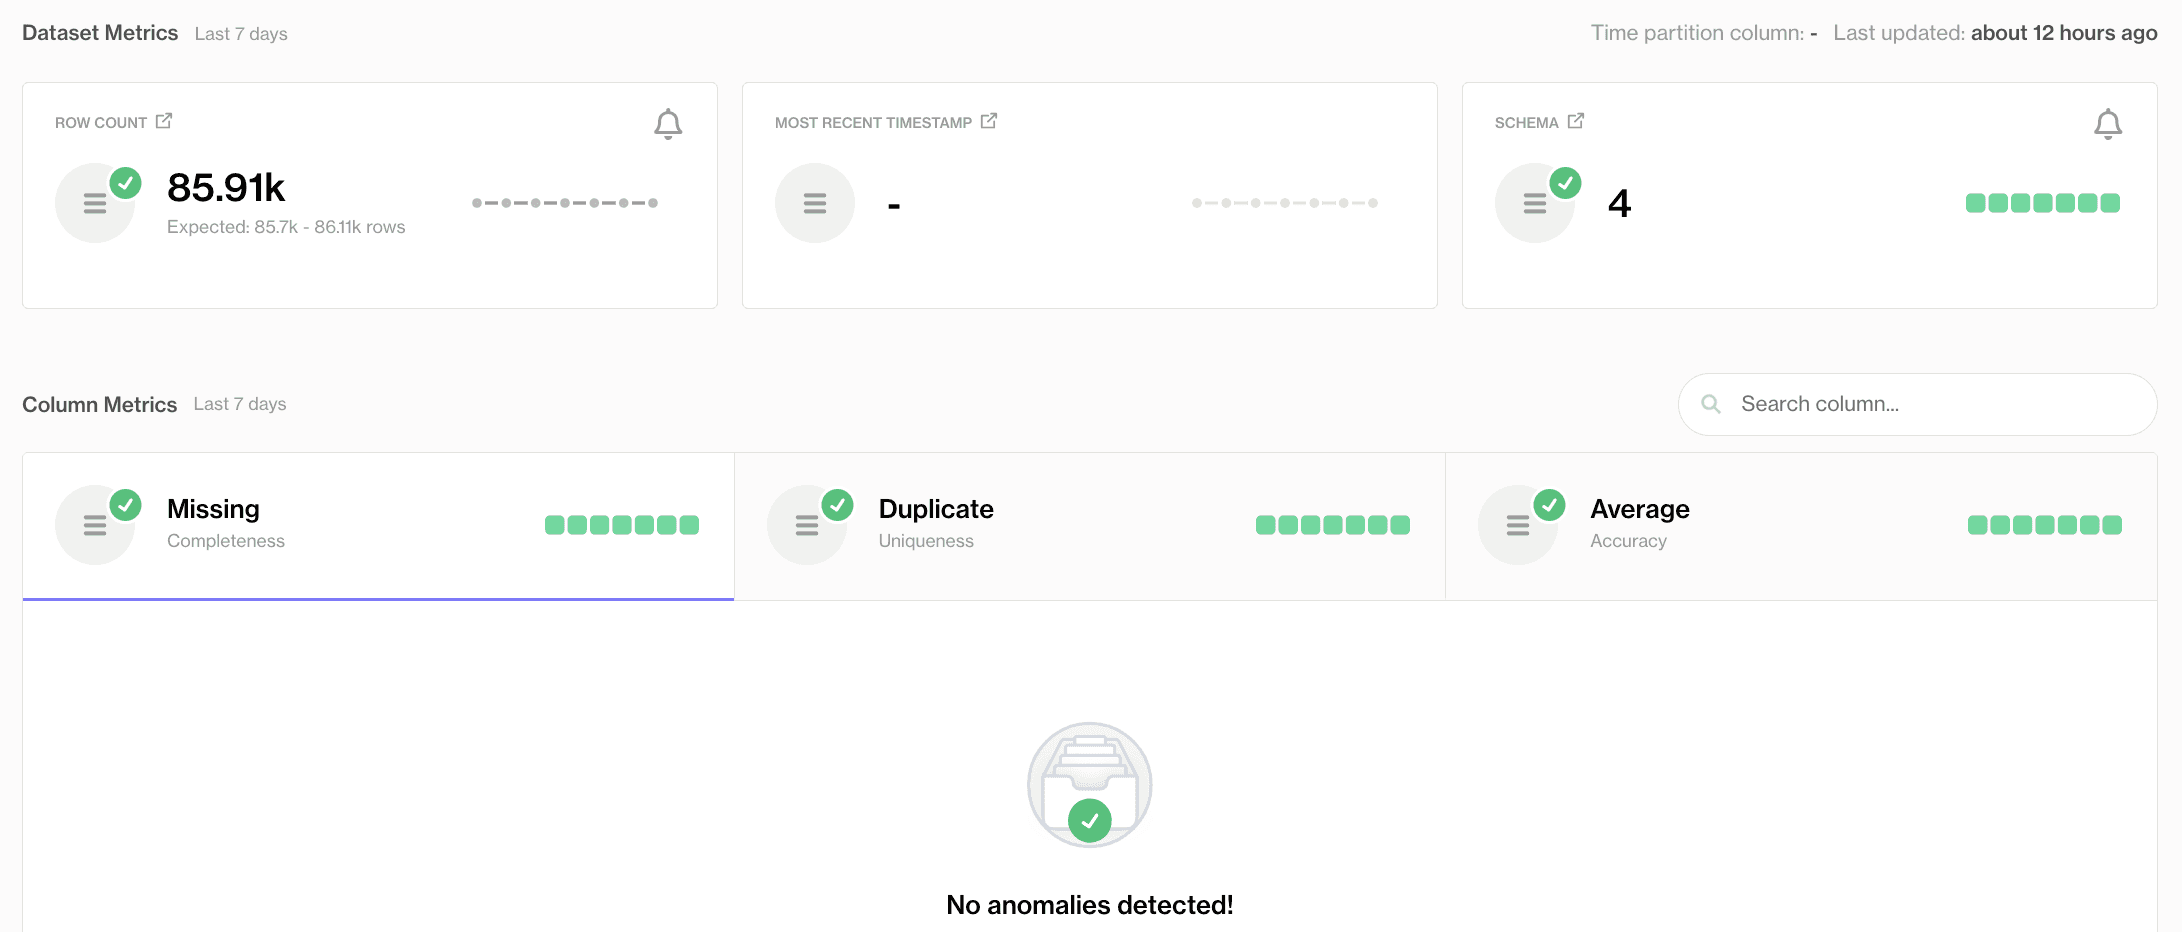
This dashboard view offers an at-a-glance summary of the dataset's health. If there’s a red flag, such as missing values, we can drill down to see exactly which rows or columns triggered the failure, saving us hours of guesswork.
Adding pre-defined Validity check
We can monitor other metrics as well:
Check Coverage (6) – The total number of data quality checks configured for this dataset.
Health (100%) – A quick, visual score indicating the overall pass/fail rate of recent checks.
Incidents – A calendar-like grid showing on which days checks have failed, passed, or triggered warnings.
Below that, there’s a detailed list of each check. In this example:
Duplicates: Zero duplicates, so this check is green and passing.
Missing values: We have missing values detected several days ago, which is why this check has red fail status indicators.
Additionally, using the 'Column' option from the top panel, we can examine the column-level details more closely. Here, we can explore each column to gather more detailed information, providing insights like basic statistics and identifying frequent and extreme values.

Colunm level insights from dataset: customer_satisfaction
Metric Dashboard
Every check has its own dashboard! For example, we can zoom in to one specific check, 'Missing Values' from the previous Dataset Dashboard CUSTOMER_SATISFACTION. Here, we can see that there was one missing value each day for the past few days, but it was resolved on 3/11/2025.
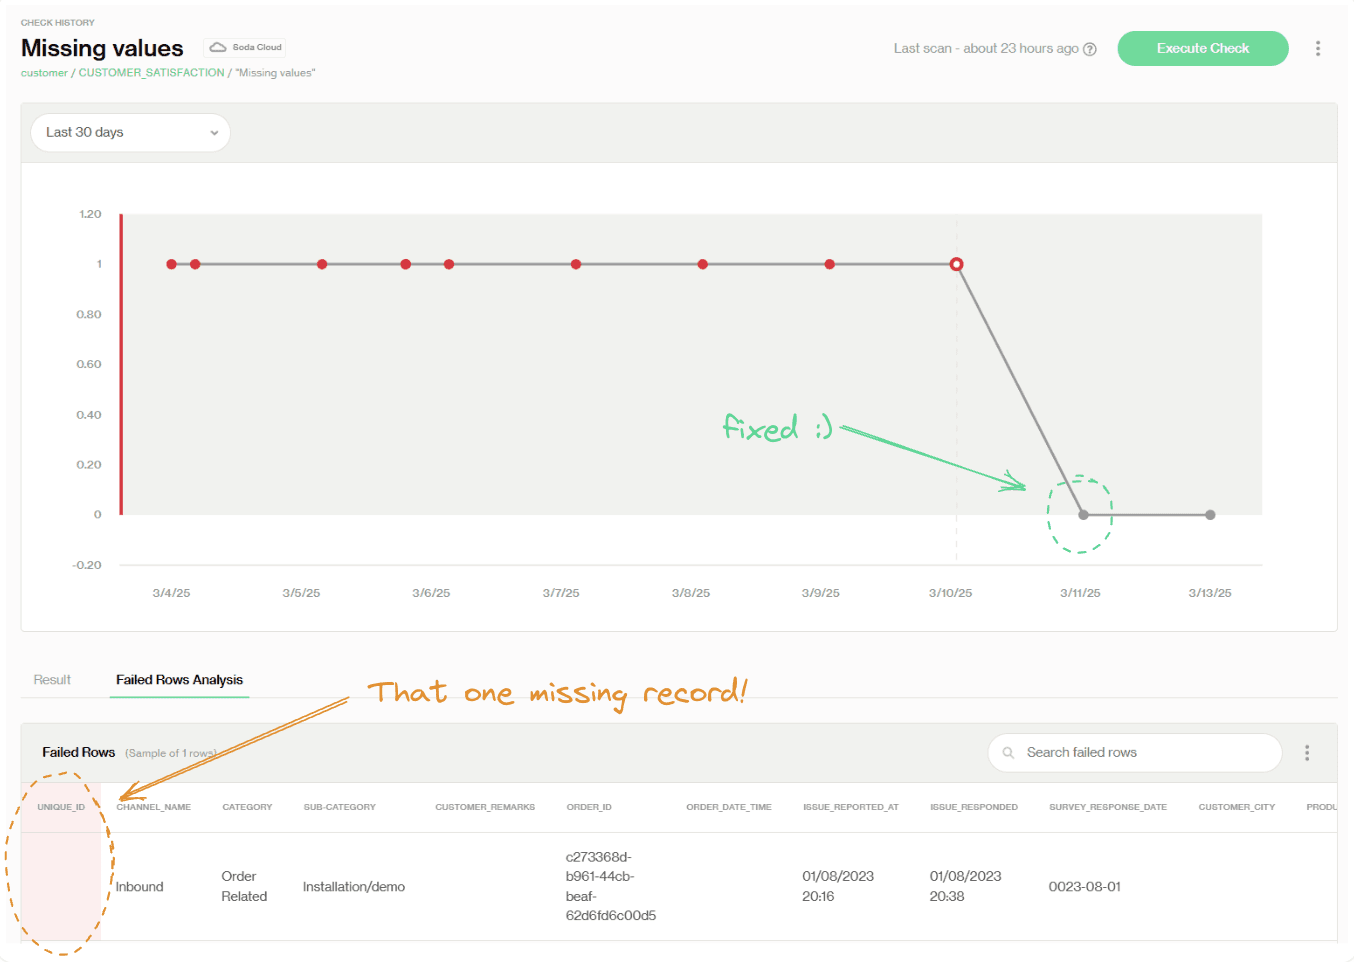
The missing values metric dashboard
The red dots in the line chart indicate failures on each scan, making it easy to see that this issue has been consistent and hasn’t improved over time.
Below the chart, in the Failed Rows Analysis tab, we can find row-level details about the failing records. If you recall from the previous section, this is where we identify the missing value issues after the first scan fails.
Soda Monitoring Dashboard Hierarchy
This is to show how to zoom in on specific failed row-level records from the big picture so you can have a better understanding of the Soda data dashboard hierarchy and what to expect for your specific use case. Let’s start from the main dashboard and see if we can find that one missing value with just a few clicks! 😎
Anomaly Observability
There are data quality issues that can't be defined or monitored from only testing and monitoring. Imagine manually changing thresholds for appropriate 'row counts' every day or trying to monitor the slightly different schema changes across 100 tables.
After all, we can’t afford to lean on static thresholds and end up blindsided by unexpected anomalies.
This means we need to shift our view from monitoring tables one by one to observing them all at once. Any new patterns that emerge against what's “normal”, we need to be ready for them, and be prepared as soon as possible.
This is what's called the Observability. It works independently, looking for anomalies that might be outside our immediate view. Soda achieves this by utilizing machine learning to observe anomalies from the regular data and publishes the detection results on the 'Anomaly Dashboard'.
Here is a list of things the anomaly dashboard helps us discover, as an example:
Spot silent changes – A gradual decrease in row counts or minor shifts in numeric columns that wouldn’t trigger basic threshold alerts.
Uncover unseen data issues – A new data feed introduced subtle duplicates that went unnoticed.
Offer deeper context – The dashboard provides a breakdown of column-level anomalies over the past week so you can see exactly which columns or rows need your attention.
The Anomaly Dashboard: A Closer Look
The anomaly dashboard detects anomalies on its own and will partition data and begin daily scans. Once activated, it will automatically create anomaly detection checks on your dataset to watch for unusual shifts.
The missing values metric dashboard
Out of the box, Soda sets up three core checks at the dataset level:
Row Volume Changes – Watches for unexpected spikes or dips in the number of rows.
Data Freshness – Alerts us if new records suddenly stop arriving when they normally would.
Schema Evolution – Flags columns that have been added, removed, or significantly changed.
Meanwhile, at the column level, Soda keeps an eye on:
Missing Values – Spots abnormal upticks in null entries.
Duplicate Values – Detects any rise in duplicate rows.
Average Values in Numeric Columns – Looks for unexpected shifts in averages.
After a short training period, usually around five days, Soda’s ML engine will have a sense of what “normal” data looks like. Then, whenever it detects something out of the ordinary, it surfaces the issue on the Anomaly Dashboard.
We can configure notifications (via Slack, MS Teams, etc.) to alert us in real time so we can jump on any anomalies before they cause bigger headaches downstream.
The Synergy of Observability, Testing, and Monitoring
At first glance, Observability, E2E Testing, and Monitoring can seem separate. But once we unite them, we will unlock a powerful synergy that leads to much more effective data governance.
An ideal DQ issue resolution:
It's a normal morning for your data team when a Slack alert appears—an anomaly flagged by Soda's observability engine. The system noticed a small change in row volume that didn't trigger a standard alert, and no one had specifically tested for it in an E2E check.
Jenny, the data analyst and dataset owner, quickly checks the Anomalies Dashboard to see which columns are affected.
Meanwhile, Dave, the data engineer, opens the monitoring dashboard for more details from the column-level statistics. He noticed that the column now contained a new form of duplication, with the same text replicated multiple times in the same row—an anomaly beyond what the current Testing and Monitoring checks could detect.
Dave fixes the issue at the source and adjusts the transformation process to match the new change, while Jenny updates the existing data quality checks.
After that, Dave updated new DQ metrics for the pipeline and performed a new E2E test. With Soda Scan confirm the fix, both the Monitoring and Anomaly dashboards remain green for the rest of the months. In the end, no overcommunications, time was saved for everyone, and the anomaly didn't affect pipeline from the downstream, the crisis averted.
A quick wrap-up
Data quality isn’t something we can afford to handle reactively. Issues won't disappear by themselves, now or in the future. To avoid data debt, we need to spot issues early, communicate effectively, and fix them collaboratively.
Imagine a world without stressed-out data engineers or constant complaints from business stakeholders. Everyone would have more time and energy to focus on what truly matters. In the end, everyone wins.
Data quality issues can surface anywhere; sometimes, we don’t know what they are, where they occur, or when they might emerge. This makes our fixes reactive, fixing problems only after complaints.
Instead of constantly tracing lineage and applying downstream fixes, we could always take a step back and focus on early detection. After all, understanding the problem is the first step toward solving it.
Although we can't predict every possible data quality issue, we do know where to look and how to investigate. In general, data quality problems can be discovered through three methods:
Pipeline Development – Issues spotted during pipeline testing.
Pre-Defined Metrics – Known issues tracked by specific quality checks or thresholds.
Hidden Anomalies – Unexpected issues that standard measurements don't cover but can be found with anomaly detection.
These three angles, however, do not suggest one is better than the other. In fact, they are all important because each one focuses on a different aspect of data quality, helping us detect issues as early as possible and as comprehensively as possible.
Common causes of data quality issues and their detection methods.
End-to-end data testing during development helps identify issues early, preventing downstream problems. Metric-based monitoring ensures consistency by detecting issues based on predefined metrics, while observability uncovers hidden anomalies that traditional monitoring might miss.
In this blog, we’ll explore how to effectively detect data quality issues in these areas using Soda, with hands-on examples that showcase how these methods work together to create proactive data quality solutions for better data governance.
Before we dive in, let’s go over some necessary preparations.
This blog was created with previous versions of Soda Core and Soda Cloud, so there might be minor code syntax and UI path differences. If you have any questions, refer to https://docs.soda.io/ |
|---|
Writing Data Quality Checks that Everyone Wants to Read
We can't expect everyone on the team to understand SQL, but does that mean data quality should be owned only by those who do? Absolutely not. Ensuring good data quality is a team effort, and it’s crucial that everyone stays on the same page.
That’s why we need a straightforward approach to defining data expectations so everyone can understand them. Soda Check Language (SodaCL) fits the role perfectly: it’s simple enough for less technical team members to grasp, yet powerful enough for developers to customize.
Here’s a quick example of how to write a data quality check for a datasetdim_customer. In the following sections, we’ll see how these checks come into play in various workflows.
Structure of a simple SodaCL check for 'row count'
End-to-End Data Quality Testing with Soda
In this section, we will discover how to validate and test data in the data pipeline before it impacts production with Soda data quality checks.
Data flows from one stage to another in a data pipeline. End-to-end (E2E) testing is all about making sure each stage in the data pipeline is reliable, from the moment data arrives in the warehouse to when it’s delivered to our downstream users.
It's the best practice to start E2E data quality testing as early as possible! Although we can usually handle data quality problems at the source, they can be very difficult to deal with if they arise later.
Using Soda data quality checks with SodaCL at each step of the data pipeline helps ensure data quality and keeps things running well.
This is especially helpful when we spot data quality issues in the upstream pipeline. To show you how this works, I created a simple data pipeline with Airflow, where the data travels from the Snowflake database, gets transformed with DBT, and has Soda running data quality checks between each stage. Here is a quick overview:
Airflow DAG data pipeline with data quality checks
Just a heads up, this section is a bit technical and lengthy, so it’s great if you already know how to create a data pipeline, especially with the Airflow DAG. The demonstration will focus on implementing Soda data quality scans within the Airflow data pipeline, and it will start under the condition that Snowflake is connected and set up with Airflow on a Windows operating system.
Prerequisites
To run the Soda data quality checks in a data pipeline, we need to have the Soda Library installed, configure it to the corresponding data source, and specify what kind of checks we want to run with it.
Install Soda
Under the current project directory, in our case 'Airflow_demo', create a directory 'Soda' and make a new virtual environment.
Install the appropriate Soda Library in the virtual environment based on the data source we want to work with. Since I'm using Snowflake, I installed Soda with
pip install -i https://pypi.cloud.soda.io soda-snowflake. If you're using a different operating system or need to set up a different data source, please refer to this installation guide accordingly.
The self-serve account creation for Soda Cloud is temporarily paused as we're preparing the general availability of several major updates. If you want to try Soda Cloud in the meantime, please schedule a call with our team of experts, discuss your use case, and get started. |
Configure Data Source and Soda Cloud
When Soda needs to run data quality checks in Airflow, it looks for a configuration.yml file to find the data source, along with another checks.yml file that contains the data quality checks you want to perform. Make sure the two files were prepared and saved in a similar structure as follows:
In the configuration.yml file, add the Snowflake account details and data source information like this, with Soda Cloud account details at the end:
data_source snowflake_db:
  type: snowflake
  connection:
    username: luca
    password: secret
    account: YOUR_SNOW_FLAKE_ACCOUNT
    database: ECOMMERCE_CUSTOMER_SATISFACTION
    warehouse: COMPUTE_WH
    role: ACCOUNTADMIN
  schema: CUSTOMER

  soda_cloud:
  host: cloud.soda.io
  api_key_id: secret
  api_key_secret
Specify data quality checks with SodaCL
In the checks.yml file, we’ll write data quality checks that Soda will use later to run on our dataset. Writing checks is really simple, like this:
checks for CUSTOMER_SATISFACTION:
  - duplicate_count(ORDER_ID) = 0:
       name: No duplicate ORDER ID
  - missing_count(ORDER_ID) = 0:
       name: No missing ORDER ID
  - schema:
       warn:
         when schema changes: any
       name
I've included three checks for my dataset CUSTOMER_SATISFACTION : a duplication check, missing value counts for the ORDER_ID column, and a schema check that will alert us if there are any changes to the columns in the future. You can also discover more checks or create your own by following the instructions in this documentation.
Lastly, in the command line, let's type in soda test-connection -d snowflake_db -c configuration.yml to start a test and see if Soda is connected to my data source and running smoothly.
Having all the configurations set in place, our next step is to integrate Soda into the Airflow pipeline.
Define a Soda Scan in DAG
To use Soda with our Airflow data pipeline, we need to start a Soda Scan workflow in an Airflow DAG. In a Soda Scan workflow, Soda will find the data source, get the access credentials (from configuration.yml), decide which checks (from checks.yml) to perform on the dataset and then provide the complete scan results.
Here is how we can achieve this with two main steps: first, create a python function for the Soda Scan workflow, and second, create a new DAG file and call this function with the @task decorator.
Step 1: Create a check() function in a new python file check_function.py in the Soda folder to set up the Soda Scan workflow:
# Invoke Soda library
def check(scan_name, checks_subpath=None,
data_source='snowflake_db', project_root='include'):
    from soda.scan import Scan

    # Soda needs both configuration & checks files to exectue the check
    config_file = f'{project_root}/soda/configuration.yml'
    checks_path = f'{project_root}/soda/checks.yml'

    if checks_subpath:
        checks_subpath += f'/{checks_subpath}'

    scan = Scan()
    scan.set_verbose()
    scan.add_configuration_yaml_file(config_file)
    scan.set_data_source_name(data_source)
    scan.add_sodacl_yaml_files(checks_path)
    scan.set_scan_definition_name(scan_name)

    result = scan.execute()
    print(scan.get_logs_text())

    if result != 0:
        raise ValueError('Soda Scan failed'
Step 2: Create an Airflow DAG that calls the check() function as an external Python task. In the DAG file, we import and invoke the check() function like this:
# DAG file: Import the check method from check_function.py
def customer():
    @task.external_python(python='/usr/local/airflow/soda_venv/bin/python')
    def check_customer(scan_name='check_customer', checks_subpath='tables',
    data_source='snowflake_db'):
        # check_function.py from the Soda folder
        from include.soda.check_function import check

        check(scan_name, checks_subpath, data_source)

    check_customer()
Your working folder should now look like this:
airflow_demo/
├── dags/
│   ├── dag_soda.py #step 2
├── Soda/
│   ├── check_function.py #step 1
│   ├── configuration.yml
│   └── checks.yml
Pipeline Stop 1: Pre-Transformation Checks
With everything set in place, we can trigger the Airflow DAG with the Soda Scan before the data gets to the transformation stage. In this process, Soda will scan the data in Snowflake and flag anything that doesn’t meet the quality rules we’ve established. Think of this as our first line of defense, catching any obvious issues before they affect the rest of the pipeline.
Data quality checks before stage 2 transformation
As soon as the DAG was triggered, we noticed a failure warning in the log, letting us know that the missing value check for the column ORDER_ID didn’t pass. Just think about it—if those missing IDs go unnoticed, downstream analytics might miss these records, which could affect our reporting on order volumes or customer satisfaction. This really highlights how important good data quality is and makes a strong case for E2E testing. After the first check ran, we got the following warnings in the terminal:
Oops! 1 failure. 0 warnings. 0 erros. 2 pass.
The flag shows that there are missing values in the table under the column ORDER_ID. To fix this, we can access the Soda Cloud UI to get more details about the rows in this particular column:
Missing rows analysis from Soda Cloud UI
From the insight of the Failed Rows Analysis, we can find all the records that didn't pass the missing value check. This information comes in a timely manner, allowing us to fix the issue during the early stages. Consequently, since we want to ensure that all customer order feedback is reviewed and analyzed later, it also helps us avoid any issues during the transformation process.
For a quick issue resolution, we can either try to recover missing records from the source, remove these entries from the table, or raise the tolerance for missing values. For demonstration purposes, I choose to increase the tolerance thresholds and allow an additional 5% of records without the ORDER_ID in the previous checks.yml file, to show you how this would work:
- missing_percentage(ORDER_ID) = 5%:
       name
Run the DAG again, and with no surprises, we get the following notification showing in the terminal:
All is good. No failures. No warnings. No errors.
Pipeline Stop 2: dbt Transformation
Now that we have the raw data checked and validated, it's time to kick off a dbt transformation in the DAG. At this stage, dbt does its usual magic—like joining tables and applying business rules—so we can get the data ready for analytics or machine learning.
In this example, the dbt's job is to create a data model that generates a new table based on the original one. This new table RESPONSIVE_RATE should include a column RESPONSE_TIME_SECONDS to track how long it takes for customer service to respond to inquiries, measured in seconds.
I won't dive into all the details about writing dbt models and triggering the DAG, as that's not the main focus of this demo.
With the Airflow DAG triggered, the previously defined Soda scan runs again (let's not forget Soda Scan will always get triggered since it's the first part of the DAG). With no alerts this time, we can find our newly aggregated table in Snowflake!
New table Responsive_Rate generated from dbt transformation
Pipeline Stop 3: Post-Transformation Checks
Our new table looks great, but we still have some work to do. While dbt does a fantastic job, it doesn’t guarantee that our data is of high standards. There’s always a chance that something unexpected might pop up.
For example, after transformation, we end up with a new table featuring the response_time_seconds metric. But what if this leads to new data quality issues, like missing timestamps, resulting in null or invalid records?
To catch these potential issues, let's add some extra data quality checks. In the same folder called 'Soda', we can create a new check_transform.yml file, which will have specific data quality checks for this transformed table:
checks for RESPONSIVE_RATE:
  - missing_count(RESPONSE_TIME_SECONDS) = 0:
       name: No missing response time
  - schema:
       warn:
         when schema changes: any
       name
Except for regular schema checks, I also included a new missing value check for the new column RESPONSE_TIME_SECONDS After this, we can repeat the similar process (stop 1 data quality check) and add this new task to the DAG.
Now the DAG file will have a complete workflow as follows:
Soda Scan → dbt Transformation → Soda Scan
# This is our dag workflow
@dag(
    start_date=datetime(2024, 3, 1),
    schedule='@daily',
    catchup=False,
    tags=["customer pipeline"],
)

# The DAG workflow
def customer():
    # Pre-transformation Soda Scan
    @task.external_python(python='/usr/local/airflow/soda_venv/bin/python')
    def check_customer(scan_name='check_customer', checks_subpath='tables',
    data_source='snowflake_db'):
        from include.soda.check_function import check

        check(scan_name, checks_subpath, data_source)

    # dbt Transformation
    transform = DbtTaskGroup(
        group_id='transform',
        project_config=DBT_PROJECT_CONFIG,
        profile_config=DBT_CONFIG,
        render_config=RenderConfig(
            load_method=LoadMode.DBT_LS,
            select=['path:models/transform']
        )
    )

    # Post-transformation Soda Scan
    @task.external_python(python='/usr/local/airflow/soda_venv/bin/python')
    def check_transform(scan_name='response_rate_check',
    checks_subpath='tables', data_source='snowflake_db'):
        from include.soda.check_function import check

        check(scan_name, checks_subpath, data_source)
Finally, the DAG is triggered again, and what we will have is this lovely DAG graph in Airflow showing that everything was executed successfully! 🎉
DAG execution workflow
Additionally, we can explore the scan results from the new table in the Soda UI in a holistic view, where our colleagues can also gain access. I won't be explaining the details here, as that's the topic of the next section :)
Soda scan results for the new dataset in Soda Cloud UI
Once everything is checked, the data is ready to use, whether it’s for a dashboard in a BI tool or for training a machine learning model. By the time it gets to these systems, we have done several checks, drastically reducing surprises and last-minute issues.
Monitoring Data Quality in Action
While E2E testing is great for making sure our data pipeline stays strong during development and changes, data quality issues can still sneak up on us at any time. It’s important to catch these issues early and fix them before they cause any trouble downstream.
After all, data quality requires long-term assurance.
Soda monitors data quality with rules, thresholds, and dashboards—like the ones we are about to explore in Soda Cloud UI—to measure data quality health. If a metric goes beyond a pre-defined threshold (for example, if the number of processed rows drops below a known baseline) or a simple schema change, we’ll receive an alert right away.
Metrics, Thresholds, and Alert Strategy
Remember the new dataset responsive_rate that we generated with the DAG before? It provides new insights into how long it usually takes for a customer representative to respond to and resolve a customer's issue.
From an analytical perspective, it would be beneficial to ensure that no customer representative's response time to customers is negative. This is a new data quality metric we intend to add now, but it was not included during our end-to-end testing.
Additionally, we’d love to receive an alert when the total number of these invalid records exceeds 2%. Let’s explore how we can achieve this in Soda dashboard!
In Soda Cloud UI, if we locate the dataset dashboard, we will be able to find several Soda pre-defined checks, as well as customizable SQL checks.
Adding pre-defined Validity check
Conveniently, we can set up a validity rule (shown as follows) with the pre-defined check called 'Validity', in here, we set the validity value min to 0—so anything negative gets flagged as an invalid value. Additionally, we change our invalid tolerance level and get alerted when the total number of invalid values reaches 2% of the total records. This way, the data owner can fix the errors in time to prevent any further issues down the line.
Adding pre-defined Validity check
Once we’ve set up all the checks, with thresholds and alerts ready to go, we can monitor data quality health on all the datasets with dashboards, where we will see logs, alerts, and trends all in one place, with no need to guess.
Soda Cloud UI offers three dashboards with three levels of granularity:
Main Dashboard monitors the overall condition of the data source
Dataset Dashboard monitors a specific dataset
Metric Dashboard for each data quality check.
Let’s check out these dashboards together, one by one.
Main Dashboard
This dashboard is our bird’s-eye view of all checks across one or more datasets. At a glance, we can see we have 1 check that has failed in the last 90 days, 0 checks that require attention, and an overall 83% data health score.
Adding pre-defined Validity check
Notice how each vertical bar represents a check run at a given time:
green for passed, red for failed, and yellow for warnings. If you hover your mouse over the bars, you can find out how many checks are passing, require attention, or are failing, and need immediate issue resolution. Like the one here:
Also, the filters option helps us group specific datasets and lets us track all the checks that ran on them all together. Here, the main dashboard shows all the metrics from combining the two datasets that we mentioned before, the original dataset CUSTOMER_SATISFACTION, and RESPONSIVE_RATE.
Dataset Dashboard
This dashboard view offers an at-a-glance summary of the dataset's health. If there’s a red flag, such as missing values, we can drill down to see exactly which rows or columns triggered the failure, saving us hours of guesswork.
Adding pre-defined Validity check
We can monitor other metrics as well:
Check Coverage (6) – The total number of data quality checks configured for this dataset.
Health (100%) – A quick, visual score indicating the overall pass/fail rate of recent checks.
Incidents – A calendar-like grid showing on which days checks have failed, passed, or triggered warnings.
Below that, there’s a detailed list of each check. In this example:
Duplicates: Zero duplicates, so this check is green and passing.
Missing values: We have missing values detected several days ago, which is why this check has red fail status indicators.
Additionally, using the 'Column' option from the top panel, we can examine the column-level details more closely. Here, we can explore each column to gather more detailed information, providing insights like basic statistics and identifying frequent and extreme values.
Colunm level insights from dataset: customer_satisfaction
Metric Dashboard
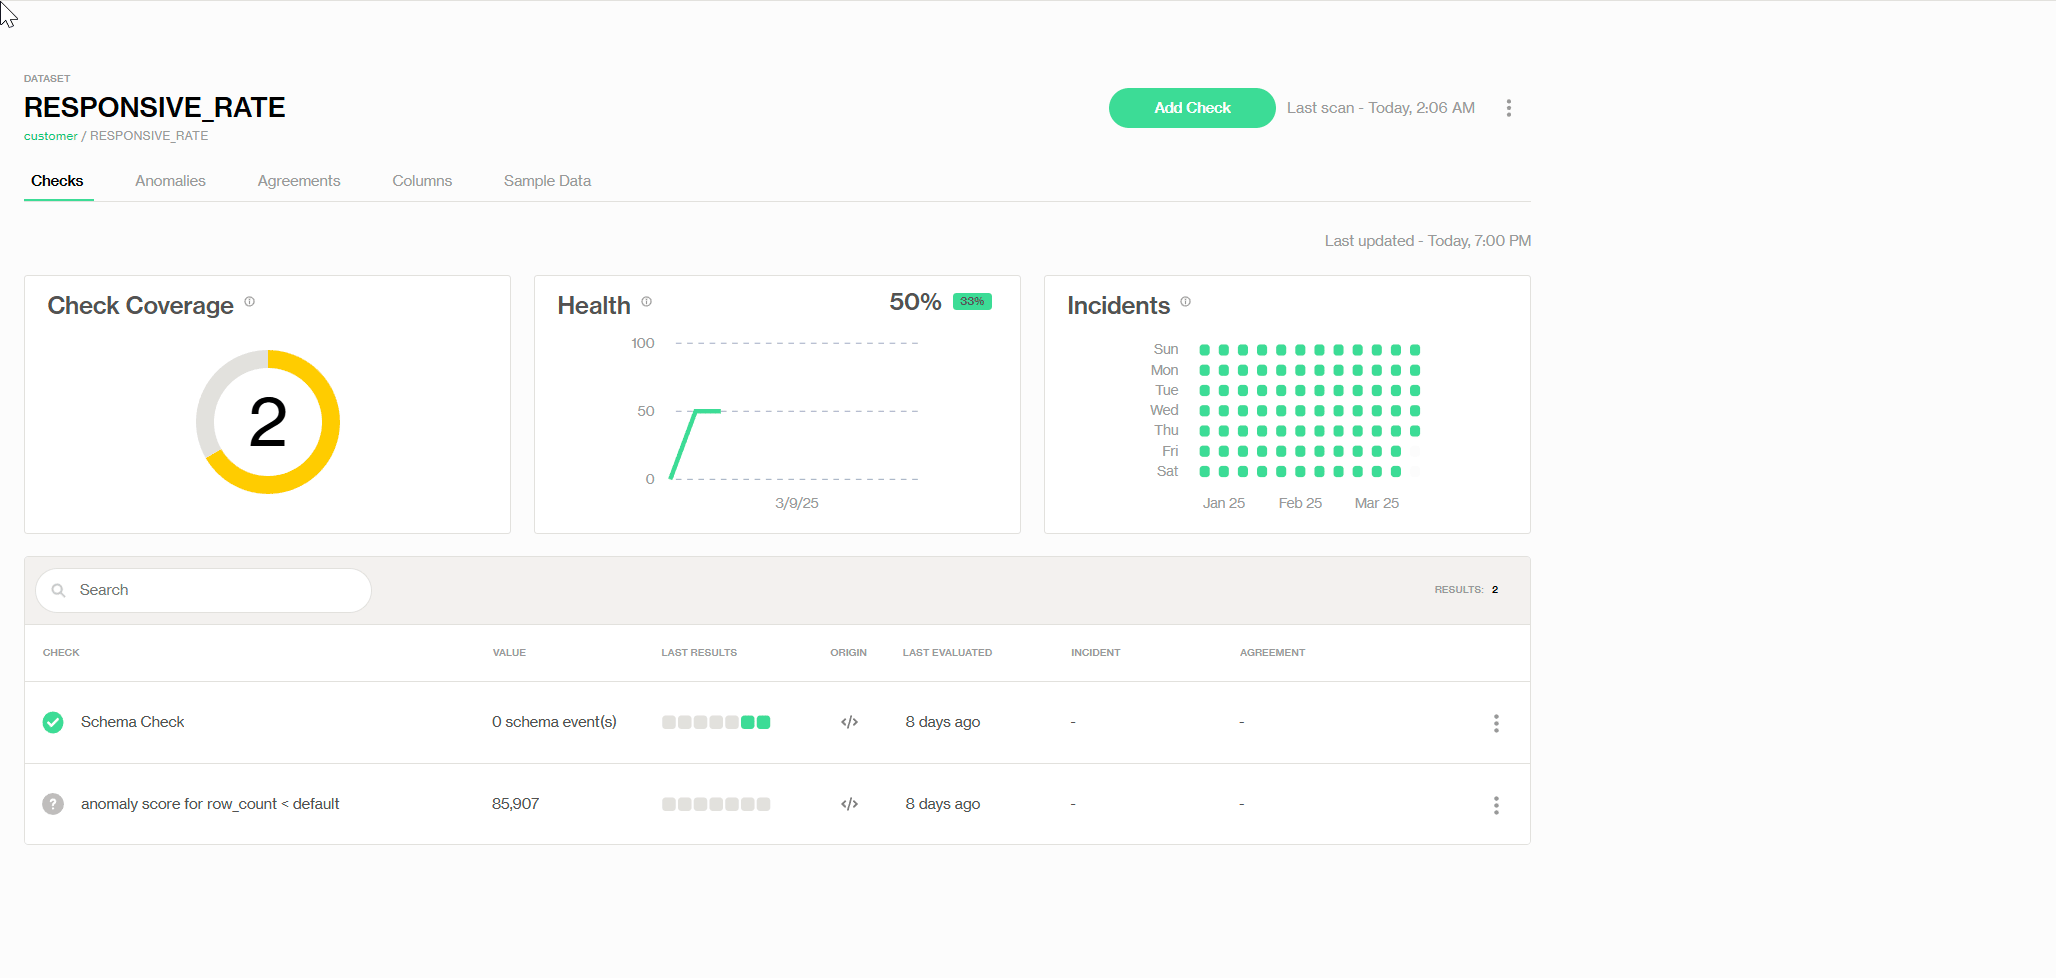
Every check has its own dashboard! For example, we can zoom in to one specific check, 'Missing Values' from the previous Dataset Dashboard CUSTOMER_SATISFACTION. Here, we can see that there was one missing value each day for the past few days, but it was resolved on 3/11/2025.
The missing values metric dashboard
The red dots in the line chart indicate failures on each scan, making it easy to see that this issue has been consistent and hasn’t improved over time.
Below the chart, in the Failed Rows Analysis tab, we can find row-level details about the failing records. If you recall from the previous section, this is where we identify the missing value issues after the first scan fails.
Soda Monitoring Dashboard Hierarchy
This is to show how to zoom in on specific failed row-level records from the big picture so you can have a better understanding of the Soda data dashboard hierarchy and what to expect for your specific use case. Let’s start from the main dashboard and see if we can find that one missing value with just a few clicks! 😎
Anomaly Observability
There are data quality issues that can't be defined or monitored from only testing and monitoring. Imagine manually changing thresholds for appropriate 'row counts' every day or trying to monitor the slightly different schema changes across 100 tables.
After all, we can’t afford to lean on static thresholds and end up blindsided by unexpected anomalies.
This means we need to shift our view from monitoring tables one by one to observing them all at once. Any new patterns that emerge against what's “normal”, we need to be ready for them, and be prepared as soon as possible.
This is what's called the Observability. It works independently, looking for anomalies that might be outside our immediate view. Soda achieves this by utilizing machine learning to observe anomalies from the regular data and publishes the detection results on the 'Anomaly Dashboard'.
Here is a list of things the anomaly dashboard helps us discover, as an example:
Spot silent changes – A gradual decrease in row counts or minor shifts in numeric columns that wouldn’t trigger basic threshold alerts.
Uncover unseen data issues – A new data feed introduced subtle duplicates that went unnoticed.
Offer deeper context – The dashboard provides a breakdown of column-level anomalies over the past week so you can see exactly which columns or rows need your attention.
The Anomaly Dashboard: A Closer Look
The anomaly dashboard detects anomalies on its own and will partition data and begin daily scans. Once activated, it will automatically create anomaly detection checks on your dataset to watch for unusual shifts.
The missing values metric dashboard
Out of the box, Soda sets up three core checks at the dataset level:
Row Volume Changes – Watches for unexpected spikes or dips in the number of rows.
Data Freshness – Alerts us if new records suddenly stop arriving when they normally would.
Schema Evolution – Flags columns that have been added, removed, or significantly changed.
Meanwhile, at the column level, Soda keeps an eye on:
Missing Values – Spots abnormal upticks in null entries.
Duplicate Values – Detects any rise in duplicate rows.
Average Values in Numeric Columns – Looks for unexpected shifts in averages.
After a short training period, usually around five days, Soda’s ML engine will have a sense of what “normal” data looks like. Then, whenever it detects something out of the ordinary, it surfaces the issue on the Anomaly Dashboard.
We can configure notifications (via Slack, MS Teams, etc.) to alert us in real time so we can jump on any anomalies before they cause bigger headaches downstream.
The Synergy of Observability, Testing, and Monitoring
At first glance, Observability, E2E Testing, and Monitoring can seem separate. But once we unite them, we will unlock a powerful synergy that leads to much more effective data governance.
An ideal DQ issue resolution:
It's a normal morning for your data team when a Slack alert appears—an anomaly flagged by Soda's observability engine. The system noticed a small change in row volume that didn't trigger a standard alert, and no one had specifically tested for it in an E2E check.
Jenny, the data analyst and dataset owner, quickly checks the Anomalies Dashboard to see which columns are affected.
Meanwhile, Dave, the data engineer, opens the monitoring dashboard for more details from the column-level statistics. He noticed that the column now contained a new form of duplication, with the same text replicated multiple times in the same row—an anomaly beyond what the current Testing and Monitoring checks could detect.
Dave fixes the issue at the source and adjusts the transformation process to match the new change, while Jenny updates the existing data quality checks.
After that, Dave updated new DQ metrics for the pipeline and performed a new E2E test. With Soda Scan confirm the fix, both the Monitoring and Anomaly dashboards remain green for the rest of the months. In the end, no overcommunications, time was saved for everyone, and the anomaly didn't affect pipeline from the downstream, the crisis averted.
A quick wrap-up
Data quality isn’t something we can afford to handle reactively. Issues won't disappear by themselves, now or in the future. To avoid data debt, we need to spot issues early, communicate effectively, and fix them collaboratively.
Imagine a world without stressed-out data engineers or constant complaints from business stakeholders. Everyone would have more time and energy to focus on what truly matters. In the end, everyone wins.
Data quality issues can surface anywhere; sometimes, we don’t know what they are, where they occur, or when they might emerge. This makes our fixes reactive, fixing problems only after complaints.
Instead of constantly tracing lineage and applying downstream fixes, we could always take a step back and focus on early detection. After all, understanding the problem is the first step toward solving it.
Although we can't predict every possible data quality issue, we do know where to look and how to investigate. In general, data quality problems can be discovered through three methods:
Pipeline Development – Issues spotted during pipeline testing.
Pre-Defined Metrics – Known issues tracked by specific quality checks or thresholds.
Hidden Anomalies – Unexpected issues that standard measurements don't cover but can be found with anomaly detection.
These three angles, however, do not suggest one is better than the other. In fact, they are all important because each one focuses on a different aspect of data quality, helping us detect issues as early as possible and as comprehensively as possible.
Common causes of data quality issues and their detection methods.
End-to-end data testing during development helps identify issues early, preventing downstream problems. Metric-based monitoring ensures consistency by detecting issues based on predefined metrics, while observability uncovers hidden anomalies that traditional monitoring might miss.
In this blog, we’ll explore how to effectively detect data quality issues in these areas using Soda, with hands-on examples that showcase how these methods work together to create proactive data quality solutions for better data governance.
Before we dive in, let’s go over some necessary preparations.
This blog was created with previous versions of Soda Core and Soda Cloud, so there might be minor code syntax and UI path differences. If you have any questions, refer to https://docs.soda.io/ |
|---|
Writing Data Quality Checks that Everyone Wants to Read
We can't expect everyone on the team to understand SQL, but does that mean data quality should be owned only by those who do? Absolutely not. Ensuring good data quality is a team effort, and it’s crucial that everyone stays on the same page.
That’s why we need a straightforward approach to defining data expectations so everyone can understand them. Soda Check Language (SodaCL) fits the role perfectly: it’s simple enough for less technical team members to grasp, yet powerful enough for developers to customize.
Here’s a quick example of how to write a data quality check for a datasetdim_customer. In the following sections, we’ll see how these checks come into play in various workflows.
Structure of a simple SodaCL check for 'row count'
End-to-End Data Quality Testing with Soda
In this section, we will discover how to validate and test data in the data pipeline before it impacts production with Soda data quality checks.
Data flows from one stage to another in a data pipeline. End-to-end (E2E) testing is all about making sure each stage in the data pipeline is reliable, from the moment data arrives in the warehouse to when it’s delivered to our downstream users.
It's the best practice to start E2E data quality testing as early as possible! Although we can usually handle data quality problems at the source, they can be very difficult to deal with if they arise later.
Using Soda data quality checks with SodaCL at each step of the data pipeline helps ensure data quality and keeps things running well.
This is especially helpful when we spot data quality issues in the upstream pipeline. To show you how this works, I created a simple data pipeline with Airflow, where the data travels from the Snowflake database, gets transformed with DBT, and has Soda running data quality checks between each stage. Here is a quick overview:
Airflow DAG data pipeline with data quality checks
Just a heads up, this section is a bit technical and lengthy, so it’s great if you already know how to create a data pipeline, especially with the Airflow DAG. The demonstration will focus on implementing Soda data quality scans within the Airflow data pipeline, and it will start under the condition that Snowflake is connected and set up with Airflow on a Windows operating system.
Prerequisites
To run the Soda data quality checks in a data pipeline, we need to have the Soda Library installed, configure it to the corresponding data source, and specify what kind of checks we want to run with it.
Install Soda
Under the current project directory, in our case 'Airflow_demo', create a directory 'Soda' and make a new virtual environment.
Install the appropriate Soda Library in the virtual environment based on the data source we want to work with. Since I'm using Snowflake, I installed Soda with
pip install -i https://pypi.cloud.soda.io soda-snowflake. If you're using a different operating system or need to set up a different data source, please refer to this installation guide accordingly.
The self-serve account creation for Soda Cloud is temporarily paused as we're preparing the general availability of several major updates. If you want to try Soda Cloud in the meantime, please schedule a call with our team of experts, discuss your use case, and get started. |
Configure Data Source and Soda Cloud
When Soda needs to run data quality checks in Airflow, it looks for a configuration.yml file to find the data source, along with another checks.yml file that contains the data quality checks you want to perform. Make sure the two files were prepared and saved in a similar structure as follows:
In the configuration.yml file, add the Snowflake account details and data source information like this, with Soda Cloud account details at the end:
data_source snowflake_db:
  type: snowflake
  connection:
    username: luca
    password: secret
    account: YOUR_SNOW_FLAKE_ACCOUNT
    database: ECOMMERCE_CUSTOMER_SATISFACTION
    warehouse: COMPUTE_WH
    role: ACCOUNTADMIN
  schema: CUSTOMER

  soda_cloud:
  host: cloud.soda.io
  api_key_id: secret
  api_key_secret
Specify data quality checks with SodaCL
In the checks.yml file, we’ll write data quality checks that Soda will use later to run on our dataset. Writing checks is really simple, like this:
checks for CUSTOMER_SATISFACTION:
  - duplicate_count(ORDER_ID) = 0:
       name: No duplicate ORDER ID
  - missing_count(ORDER_ID) = 0:
       name: No missing ORDER ID
  - schema:
       warn:
         when schema changes: any
       name
I've included three checks for my dataset CUSTOMER_SATISFACTION : a duplication check, missing value counts for the ORDER_ID column, and a schema check that will alert us if there are any changes to the columns in the future. You can also discover more checks or create your own by following the instructions in this documentation.
Lastly, in the command line, let's type in soda test-connection -d snowflake_db -c configuration.yml to start a test and see if Soda is connected to my data source and running smoothly.
Having all the configurations set in place, our next step is to integrate Soda into the Airflow pipeline.
Define a Soda Scan in DAG
To use Soda with our Airflow data pipeline, we need to start a Soda Scan workflow in an Airflow DAG. In a Soda Scan workflow, Soda will find the data source, get the access credentials (from configuration.yml), decide which checks (from checks.yml) to perform on the dataset and then provide the complete scan results.
Here is how we can achieve this with two main steps: first, create a python function for the Soda Scan workflow, and second, create a new DAG file and call this function with the @task decorator.
Step 1: Create a check() function in a new python file check_function.py in the Soda folder to set up the Soda Scan workflow:
# Invoke Soda library
def check(scan_name, checks_subpath=None,
data_source='snowflake_db', project_root='include'):
    from soda.scan import Scan

    # Soda needs both configuration & checks files to exectue the check
    config_file = f'{project_root}/soda/configuration.yml'
    checks_path = f'{project_root}/soda/checks.yml'

    if checks_subpath:
        checks_subpath += f'/{checks_subpath}'

    scan = Scan()
    scan.set_verbose()
    scan.add_configuration_yaml_file(config_file)
    scan.set_data_source_name(data_source)
    scan.add_sodacl_yaml_files(checks_path)
    scan.set_scan_definition_name(scan_name)

    result = scan.execute()
    print(scan.get_logs_text())

    if result != 0:
        raise ValueError('Soda Scan failed'
Step 2: Create an Airflow DAG that calls the check() function as an external Python task. In the DAG file, we import and invoke the check() function like this:
# DAG file: Import the check method from check_function.py
def customer():
    @task.external_python(python='/usr/local/airflow/soda_venv/bin/python')
    def check_customer(scan_name='check_customer', checks_subpath='tables',
    data_source='snowflake_db'):
        # check_function.py from the Soda folder
        from include.soda.check_function import check

        check(scan_name, checks_subpath, data_source)

    check_customer()
Your working folder should now look like this:
airflow_demo/
├── dags/
│   ├── dag_soda.py #step 2
├── Soda/
│   ├── check_function.py #step 1
│   ├── configuration.yml
│   └── checks.yml
Pipeline Stop 1: Pre-Transformation Checks
With everything set in place, we can trigger the Airflow DAG with the Soda Scan before the data gets to the transformation stage. In this process, Soda will scan the data in Snowflake and flag anything that doesn’t meet the quality rules we’ve established. Think of this as our first line of defense, catching any obvious issues before they affect the rest of the pipeline.
Data quality checks before stage 2 transformation
As soon as the DAG was triggered, we noticed a failure warning in the log, letting us know that the missing value check for the column ORDER_ID didn’t pass. Just think about it—if those missing IDs go unnoticed, downstream analytics might miss these records, which could affect our reporting on order volumes or customer satisfaction. This really highlights how important good data quality is and makes a strong case for E2E testing. After the first check ran, we got the following warnings in the terminal:
Oops! 1 failure. 0 warnings. 0 erros. 2 pass.
The flag shows that there are missing values in the table under the column ORDER_ID. To fix this, we can access the Soda Cloud UI to get more details about the rows in this particular column:
Missing rows analysis from Soda Cloud UI
From the insight of the Failed Rows Analysis, we can find all the records that didn't pass the missing value check. This information comes in a timely manner, allowing us to fix the issue during the early stages. Consequently, since we want to ensure that all customer order feedback is reviewed and analyzed later, it also helps us avoid any issues during the transformation process.
For a quick issue resolution, we can either try to recover missing records from the source, remove these entries from the table, or raise the tolerance for missing values. For demonstration purposes, I choose to increase the tolerance thresholds and allow an additional 5% of records without the ORDER_ID in the previous checks.yml file, to show you how this would work:
- missing_percentage(ORDER_ID) = 5%:
       name
Run the DAG again, and with no surprises, we get the following notification showing in the terminal:
All is good. No failures. No warnings. No errors.
Pipeline Stop 2: dbt Transformation
Now that we have the raw data checked and validated, it's time to kick off a dbt transformation in the DAG. At this stage, dbt does its usual magic—like joining tables and applying business rules—so we can get the data ready for analytics or machine learning.
In this example, the dbt's job is to create a data model that generates a new table based on the original one. This new table RESPONSIVE_RATE should include a column RESPONSE_TIME_SECONDS to track how long it takes for customer service to respond to inquiries, measured in seconds.
I won't dive into all the details about writing dbt models and triggering the DAG, as that's not the main focus of this demo.
With the Airflow DAG triggered, the previously defined Soda scan runs again (let's not forget Soda Scan will always get triggered since it's the first part of the DAG). With no alerts this time, we can find our newly aggregated table in Snowflake!
New table Responsive_Rate generated from dbt transformation
Pipeline Stop 3: Post-Transformation Checks
Our new table looks great, but we still have some work to do. While dbt does a fantastic job, it doesn’t guarantee that our data is of high standards. There’s always a chance that something unexpected might pop up.
For example, after transformation, we end up with a new table featuring the response_time_seconds metric. But what if this leads to new data quality issues, like missing timestamps, resulting in null or invalid records?
To catch these potential issues, let's add some extra data quality checks. In the same folder called 'Soda', we can create a new check_transform.yml file, which will have specific data quality checks for this transformed table:
checks for RESPONSIVE_RATE:
  - missing_count(RESPONSE_TIME_SECONDS) = 0:
       name: No missing response time
  - schema:
       warn:
         when schema changes: any
       name
Except for regular schema checks, I also included a new missing value check for the new column RESPONSE_TIME_SECONDS After this, we can repeat the similar process (stop 1 data quality check) and add this new task to the DAG.
Now the DAG file will have a complete workflow as follows:
Soda Scan → dbt Transformation → Soda Scan
# This is our dag workflow
@dag(
    start_date=datetime(2024, 3, 1),
    schedule='@daily',
    catchup=False,
    tags=["customer pipeline"],
)

# The DAG workflow
def customer():
    # Pre-transformation Soda Scan
    @task.external_python(python='/usr/local/airflow/soda_venv/bin/python')
    def check_customer(scan_name='check_customer', checks_subpath='tables',
    data_source='snowflake_db'):
        from include.soda.check_function import check

        check(scan_name, checks_subpath, data_source)

    # dbt Transformation
    transform = DbtTaskGroup(
        group_id='transform',
        project_config=DBT_PROJECT_CONFIG,
        profile_config=DBT_CONFIG,
        render_config=RenderConfig(
            load_method=LoadMode.DBT_LS,
            select=['path:models/transform']
        )
    )

    # Post-transformation Soda Scan
    @task.external_python(python='/usr/local/airflow/soda_venv/bin/python')
    def check_transform(scan_name='response_rate_check',
    checks_subpath='tables', data_source='snowflake_db'):
        from include.soda.check_function import check

        check(scan_name, checks_subpath, data_source)
Finally, the DAG is triggered again, and what we will have is this lovely DAG graph in Airflow showing that everything was executed successfully! 🎉
DAG execution workflow
Additionally, we can explore the scan results from the new table in the Soda UI in a holistic view, where our colleagues can also gain access. I won't be explaining the details here, as that's the topic of the next section :)
Soda scan results for the new dataset in Soda Cloud UI
Once everything is checked, the data is ready to use, whether it’s for a dashboard in a BI tool or for training a machine learning model. By the time it gets to these systems, we have done several checks, drastically reducing surprises and last-minute issues.
Monitoring Data Quality in Action
While E2E testing is great for making sure our data pipeline stays strong during development and changes, data quality issues can still sneak up on us at any time. It’s important to catch these issues early and fix them before they cause any trouble downstream.
After all, data quality requires long-term assurance.
Soda monitors data quality with rules, thresholds, and dashboards—like the ones we are about to explore in Soda Cloud UI—to measure data quality health. If a metric goes beyond a pre-defined threshold (for example, if the number of processed rows drops below a known baseline) or a simple schema change, we’ll receive an alert right away.
Metrics, Thresholds, and Alert Strategy
Remember the new dataset responsive_rate that we generated with the DAG before? It provides new insights into how long it usually takes for a customer representative to respond to and resolve a customer's issue.
From an analytical perspective, it would be beneficial to ensure that no customer representative's response time to customers is negative. This is a new data quality metric we intend to add now, but it was not included during our end-to-end testing.
Additionally, we’d love to receive an alert when the total number of these invalid records exceeds 2%. Let’s explore how we can achieve this in Soda dashboard!
In Soda Cloud UI, if we locate the dataset dashboard, we will be able to find several Soda pre-defined checks, as well as customizable SQL checks.
Adding pre-defined Validity check
Conveniently, we can set up a validity rule (shown as follows) with the pre-defined check called 'Validity', in here, we set the validity value min to 0—so anything negative gets flagged as an invalid value. Additionally, we change our invalid tolerance level and get alerted when the total number of invalid values reaches 2% of the total records. This way, the data owner can fix the errors in time to prevent any further issues down the line.
Adding pre-defined Validity check
Once we’ve set up all the checks, with thresholds and alerts ready to go, we can monitor data quality health on all the datasets with dashboards, where we will see logs, alerts, and trends all in one place, with no need to guess.
Soda Cloud UI offers three dashboards with three levels of granularity:
Main Dashboard monitors the overall condition of the data source
Dataset Dashboard monitors a specific dataset
Metric Dashboard for each data quality check.
Let’s check out these dashboards together, one by one.
Main Dashboard
This dashboard is our bird’s-eye view of all checks across one or more datasets. At a glance, we can see we have 1 check that has failed in the last 90 days, 0 checks that require attention, and an overall 83% data health score.
Adding pre-defined Validity check
Notice how each vertical bar represents a check run at a given time:
green for passed, red for failed, and yellow for warnings. If you hover your mouse over the bars, you can find out how many checks are passing, require attention, or are failing, and need immediate issue resolution. Like the one here:
Also, the filters option helps us group specific datasets and lets us track all the checks that ran on them all together. Here, the main dashboard shows all the metrics from combining the two datasets that we mentioned before, the original dataset CUSTOMER_SATISFACTION, and RESPONSIVE_RATE.
Dataset Dashboard
This dashboard view offers an at-a-glance summary of the dataset's health. If there’s a red flag, such as missing values, we can drill down to see exactly which rows or columns triggered the failure, saving us hours of guesswork.
Adding pre-defined Validity check
We can monitor other metrics as well:
Check Coverage (6) – The total number of data quality checks configured for this dataset.
Health (100%) – A quick, visual score indicating the overall pass/fail rate of recent checks.
Incidents – A calendar-like grid showing on which days checks have failed, passed, or triggered warnings.
Below that, there’s a detailed list of each check. In this example:
Duplicates: Zero duplicates, so this check is green and passing.
Missing values: We have missing values detected several days ago, which is why this check has red fail status indicators.
Additionally, using the 'Column' option from the top panel, we can examine the column-level details more closely. Here, we can explore each column to gather more detailed information, providing insights like basic statistics and identifying frequent and extreme values.
Colunm level insights from dataset: customer_satisfaction
Metric Dashboard
Every check has its own dashboard! For example, we can zoom in to one specific check, 'Missing Values' from the previous Dataset Dashboard CUSTOMER_SATISFACTION. Here, we can see that there was one missing value each day for the past few days, but it was resolved on 3/11/2025.
The missing values metric dashboard
The red dots in the line chart indicate failures on each scan, making it easy to see that this issue has been consistent and hasn’t improved over time.
Below the chart, in the Failed Rows Analysis tab, we can find row-level details about the failing records. If you recall from the previous section, this is where we identify the missing value issues after the first scan fails.
Soda Monitoring Dashboard Hierarchy
This is to show how to zoom in on specific failed row-level records from the big picture so you can have a better understanding of the Soda data dashboard hierarchy and what to expect for your specific use case. Let’s start from the main dashboard and see if we can find that one missing value with just a few clicks! 😎
Anomaly Observability
There are data quality issues that can't be defined or monitored from only testing and monitoring. Imagine manually changing thresholds for appropriate 'row counts' every day or trying to monitor the slightly different schema changes across 100 tables.
After all, we can’t afford to lean on static thresholds and end up blindsided by unexpected anomalies.
This means we need to shift our view from monitoring tables one by one to observing them all at once. Any new patterns that emerge against what's “normal”, we need to be ready for them, and be prepared as soon as possible.
This is what's called the Observability. It works independently, looking for anomalies that might be outside our immediate view. Soda achieves this by utilizing machine learning to observe anomalies from the regular data and publishes the detection results on the 'Anomaly Dashboard'.
Here is a list of things the anomaly dashboard helps us discover, as an example:
Spot silent changes – A gradual decrease in row counts or minor shifts in numeric columns that wouldn’t trigger basic threshold alerts.
Uncover unseen data issues – A new data feed introduced subtle duplicates that went unnoticed.
Offer deeper context – The dashboard provides a breakdown of column-level anomalies over the past week so you can see exactly which columns or rows need your attention.
The Anomaly Dashboard: A Closer Look
The anomaly dashboard detects anomalies on its own and will partition data and begin daily scans. Once activated, it will automatically create anomaly detection checks on your dataset to watch for unusual shifts.
The missing values metric dashboard
Out of the box, Soda sets up three core checks at the dataset level:
Row Volume Changes – Watches for unexpected spikes or dips in the number of rows.
Data Freshness – Alerts us if new records suddenly stop arriving when they normally would.
Schema Evolution – Flags columns that have been added, removed, or significantly changed.
Meanwhile, at the column level, Soda keeps an eye on:
Missing Values – Spots abnormal upticks in null entries.
Duplicate Values – Detects any rise in duplicate rows.
Average Values in Numeric Columns – Looks for unexpected shifts in averages.
After a short training period, usually around five days, Soda’s ML engine will have a sense of what “normal” data looks like. Then, whenever it detects something out of the ordinary, it surfaces the issue on the Anomaly Dashboard.
We can configure notifications (via Slack, MS Teams, etc.) to alert us in real time so we can jump on any anomalies before they cause bigger headaches downstream.
The Synergy of Observability, Testing, and Monitoring
At first glance, Observability, E2E Testing, and Monitoring can seem separate. But once we unite them, we will unlock a powerful synergy that leads to much more effective data governance.
An ideal DQ issue resolution:
It's a normal morning for your data team when a Slack alert appears—an anomaly flagged by Soda's observability engine. The system noticed a small change in row volume that didn't trigger a standard alert, and no one had specifically tested for it in an E2E check.
Jenny, the data analyst and dataset owner, quickly checks the Anomalies Dashboard to see which columns are affected.
Meanwhile, Dave, the data engineer, opens the monitoring dashboard for more details from the column-level statistics. He noticed that the column now contained a new form of duplication, with the same text replicated multiple times in the same row—an anomaly beyond what the current Testing and Monitoring checks could detect.
Dave fixes the issue at the source and adjusts the transformation process to match the new change, while Jenny updates the existing data quality checks.
After that, Dave updated new DQ metrics for the pipeline and performed a new E2E test. With Soda Scan confirm the fix, both the Monitoring and Anomaly dashboards remain green for the rest of the months. In the end, no overcommunications, time was saved for everyone, and the anomaly didn't affect pipeline from the downstream, the crisis averted.
A quick wrap-up
Data quality isn’t something we can afford to handle reactively. Issues won't disappear by themselves, now or in the future. To avoid data debt, we need to spot issues early, communicate effectively, and fix them collaboratively.
Imagine a world without stressed-out data engineers or constant complaints from business stakeholders. Everyone would have more time and energy to focus on what truly matters. In the end, everyone wins.
Trusted by the world’s leading enterprises
Real stories from companies using Soda to keep their data reliable, accurate, and ready for action.
At the end of the day, we don’t want to be in there managing the checks, updating the checks, adding the checks. We just want to go and observe what’s happening, and that’s what Soda is enabling right now.

Sid Srivastava
Director of Data Governance, Quality and MLOps
Investing in data quality is key for cross-functional teams to make accurate, complete decisions with fewer risks and greater returns, using initiatives such as product thinking, data governance, and self-service platforms.

Mario Konschake
Director of Product-Data Platform
Soda has integrated seamlessly into our technology stack and given us the confidence to find, analyze, implement, and resolve data issues through a simple self-serve capability.

Sutaraj Dutta
Data Engineering Manager
Our goal was to deliver high-quality datasets in near real-time, ensuring dashboards reflect live data as it flows in. But beyond solving technical challenges, we wanted to spark a cultural shift - empowering the entire organization to make decisions grounded in accurate, timely data.

Gu Xie
Head of Data Engineering
4.4 of 5
Your data has problems.
Now they fix themselves.
Automated data quality, remediation, and management.
One platform, agents that do the work, you approve.
Trusted by


Trusted by the world’s leading enterprises
Real stories from companies using Soda to keep their data reliable, accurate, and ready for action.
At the end of the day, we don’t want to be in there managing the checks, updating the checks, adding the checks. We just want to go and observe what’s happening, and that’s what Soda is enabling right now.
Sid Srivastava
Director of Data Governance, Quality and MLOps
Investing in data quality is key for cross-functional teams to make accurate, complete decisions with fewer risks and greater returns, using initiatives such as product thinking, data governance, and self-service platforms.
Mario Konschake
Director of Product-Data Platform
Soda has integrated seamlessly into our technology stack and given us the confidence to find, analyze, implement, and resolve data issues through a simple self-serve capability.
Sutaraj Dutta
Data Engineering Manager
Our goal was to deliver high-quality datasets in near real-time, ensuring dashboards reflect live data as it flows in. But beyond solving technical challenges, we wanted to spark a cultural shift - empowering the entire organization to make decisions grounded in accurate, timely data.
Gu Xie
Head of Data Engineering
4.4 of 5
Your data has problems.
Now they fix themselves.
Automated data quality, remediation, and management.
One platform, agents that do the work, you approve.
Trusted by
Solutions