
Data stewards, record owners, and the business teams accountable for data in systems of record share a common job: keeping data usable, trusted, and understood across the datasets, definitions, and downstream consumers that depend on them. Without the right tooling, that accountability turns into a job of chasing teams through Slack, assembling audit evidence by hand, and policing definitions across half a dozen tabs.
This is a walkthrough of what that work looks like inside Soda: triaging the work queue, monitoring data behavior, investigating anomalies, defining contracts, collaborating with data consumers, and approving agent-assisted remediation, all from a single workflow.
Key Takeaways |
|---|
|
The Steward's Day, Inside Soda
At its core, the steward's job is to keep data healthy and usable: defining terms, tracing lineage, flagging silent failures, monitoring quality rules, making access and retention calls, and translating between technical and business teams.
Soda is an AI-native data quality platform designed to make data governance operational. It gives data stewards direct visibility into how data behaves, detects quality issues automatically, and provides a structured path from detection to resolution.
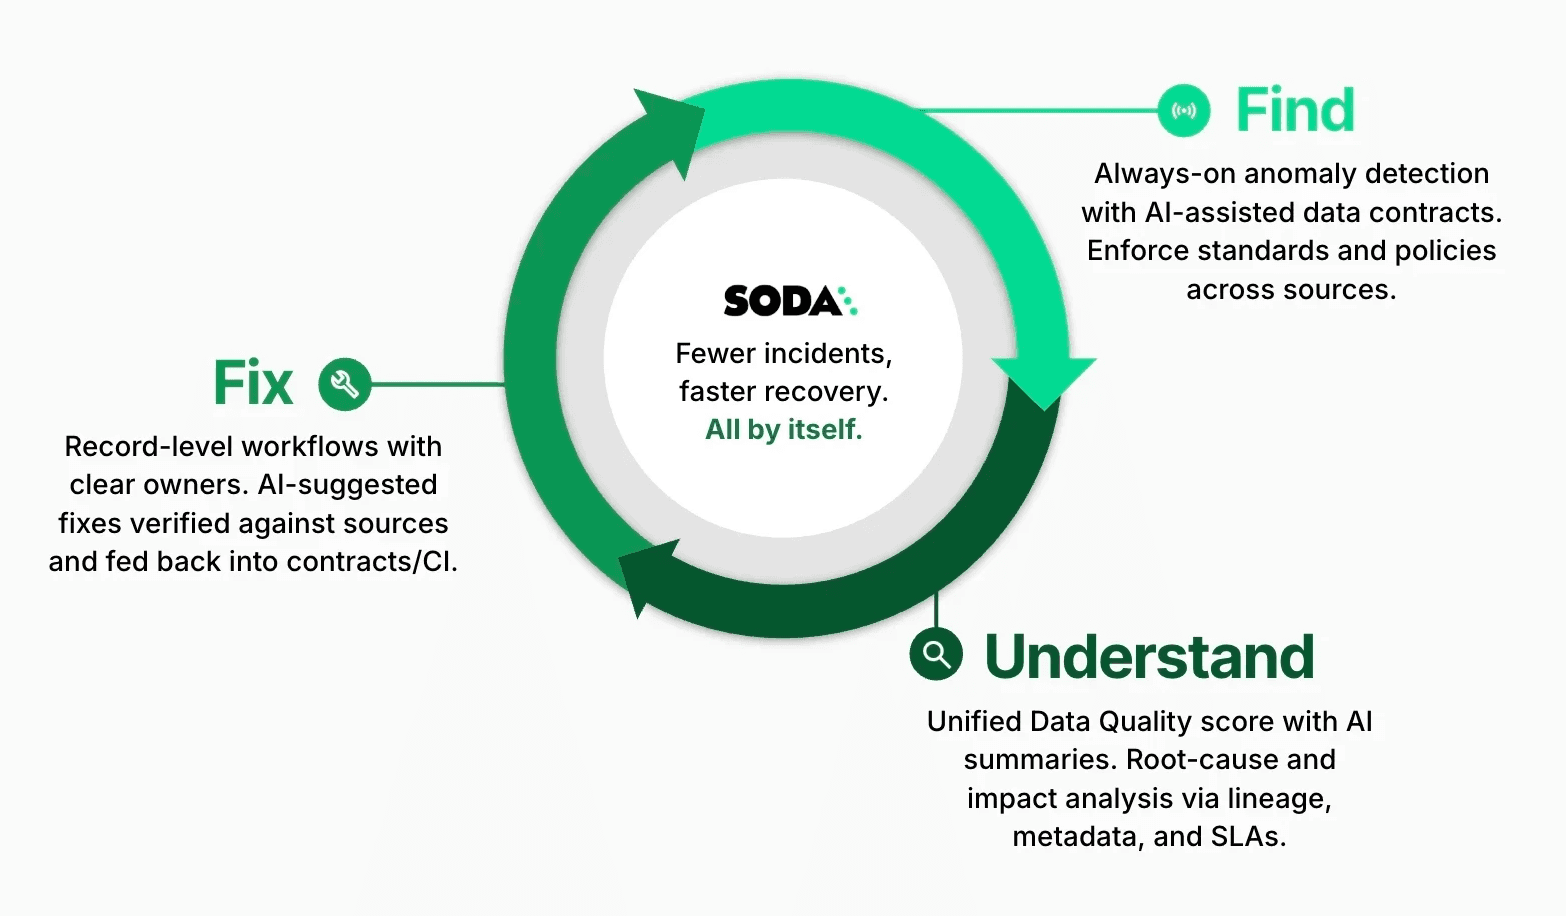
Soda follows a three-phase loop: find the issue, understand what happened, fix it at the source. The walkthrough below traces each phase through the surfaces stewards and record owners actually touch — the work queue, the metric monitors, the incident panel, the contracts, and the Soda Cleanse Inbox.
Here's how a typical day unfolds for a steward working in Soda.
Find: Detect Issues Automatically and Continuously
Triaging the Work Queue: Organization Dashboard
The day starts in Soda's organization dashboard. Overnight scans, incidents, and requests from data consumers all surface in a single view, filtered to the domains the steward owns.
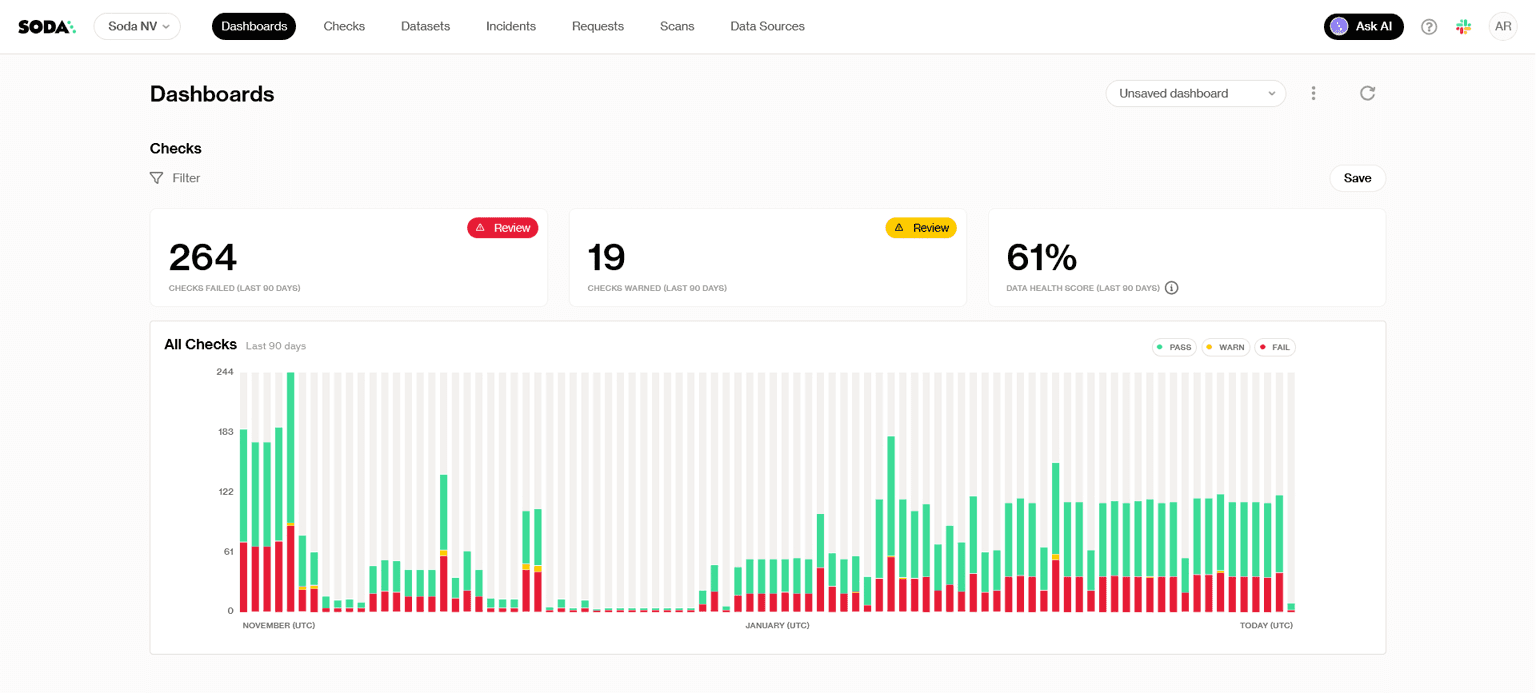
Three things sit on a typical morning triage list:
Anomalies flagged by Soda AI. Red markers on the metric time series show deviations the automated detection caught overnight. One click opens the detail panel with the historical trend, so the steward can mark the point as expected (feeding the model's learning loop) or escalate it to an incident.
Incidents in the steward's domain. Automatic ownership routing means only the incidents tied to the steward's datasets land here, each with the triggering check, who reported it, and the current status.
Requests from data consumers. Analysts and business users can propose standards or flag questions via the Request panel, and those queue up alongside the quality signals.
From here, the steward approves, defers, or pins the items that will shape the day. Smart Alerting keeps the queue focused instead of drowned in noise.
Soda gives stewards two lenses on the same data: rule-based (data contracts encode what "good" looks like in advance) and behavioral (data observability catches anomalies that don't violate any rule but fall outside the dataset's normal pattern).
Monitoring Data Behavior: Metric Monitoring
Once the steward onboards a new dataset, Soda immediately reconstructs the dataset’s history and displays a full year of patterns. Baselines, trends, and stability ranges are visible even before the first new scan runs.
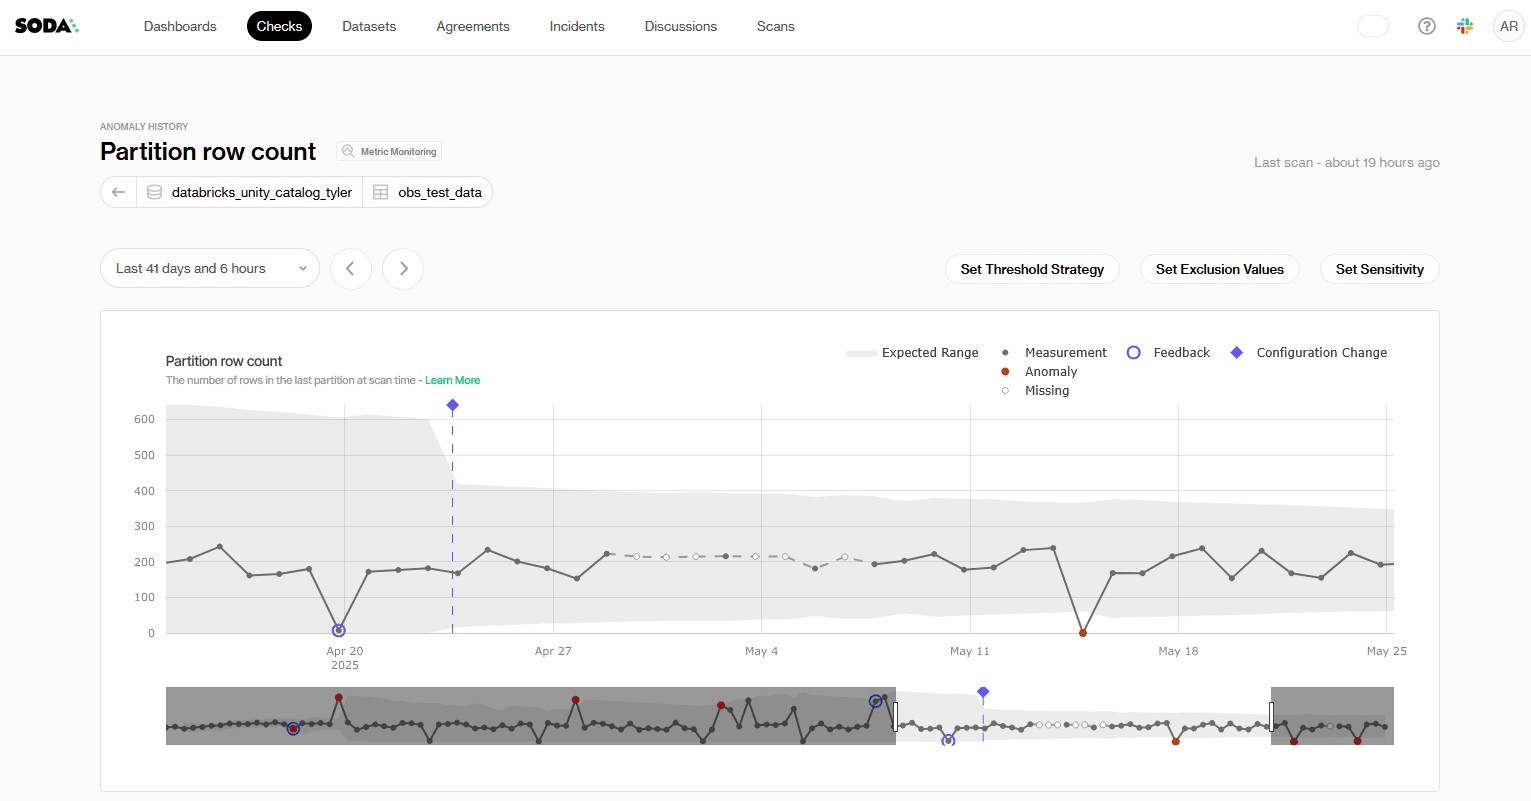
Each scan afterwards will add onto that context. The metric monitoring dashboard will instantly surface deviations or anomalous behavior in the datasets. It can track checks through two levels.
Dataset-level checks:
Row volume changes
Data freshness delays
Schema evolution (added, missing, or changed columns)
Column-level checks:
Spikes in missing values
Increases in duplicates
Shifts in numeric averages
Here, the main job of the data steward is to configure the dashboard according to the specific demands of each dataset.
The three configurations you can use to fine-tune results are:
Threshold Strategy: Some datasets require strict oversight of drops, while surges create no real risk. If your metric behaves this way, you enable the lower range and focus only on downward movement.
Exclusion Values: Test rows, placeholder timestamps, and known maintenance gaps are examples of repeating values in some datasets that have no analytical significance. You can add an exclusion value when that pattern appears in your data so Soda ignores those points and excludes them from anomaly assessments.
Sensitivity: Some datasets behave predictably, and you may want alerts for even the slightest discrepancy. For those, set a tighter alert threshold (lower z-score). Other datasets shift naturally, so a higher z-score broadens the band and highlights only the biggest movements.
Soda handles the pattern recognition while you shape what “important” means for your team.
Defining Expectations: Data Contracts
A data contract is an executable agreement that validates data as it flows. When the data matches the contract, it moves downstream. When it doesn't, the pipeline blocks, quarantines, alerts, or flags the dataset as invalid, depending on how strict you want enforcement to be.
Soda's no-code data contracts empower data stewards to translate written policies into executable checks and apply rigorous rules over data quality.
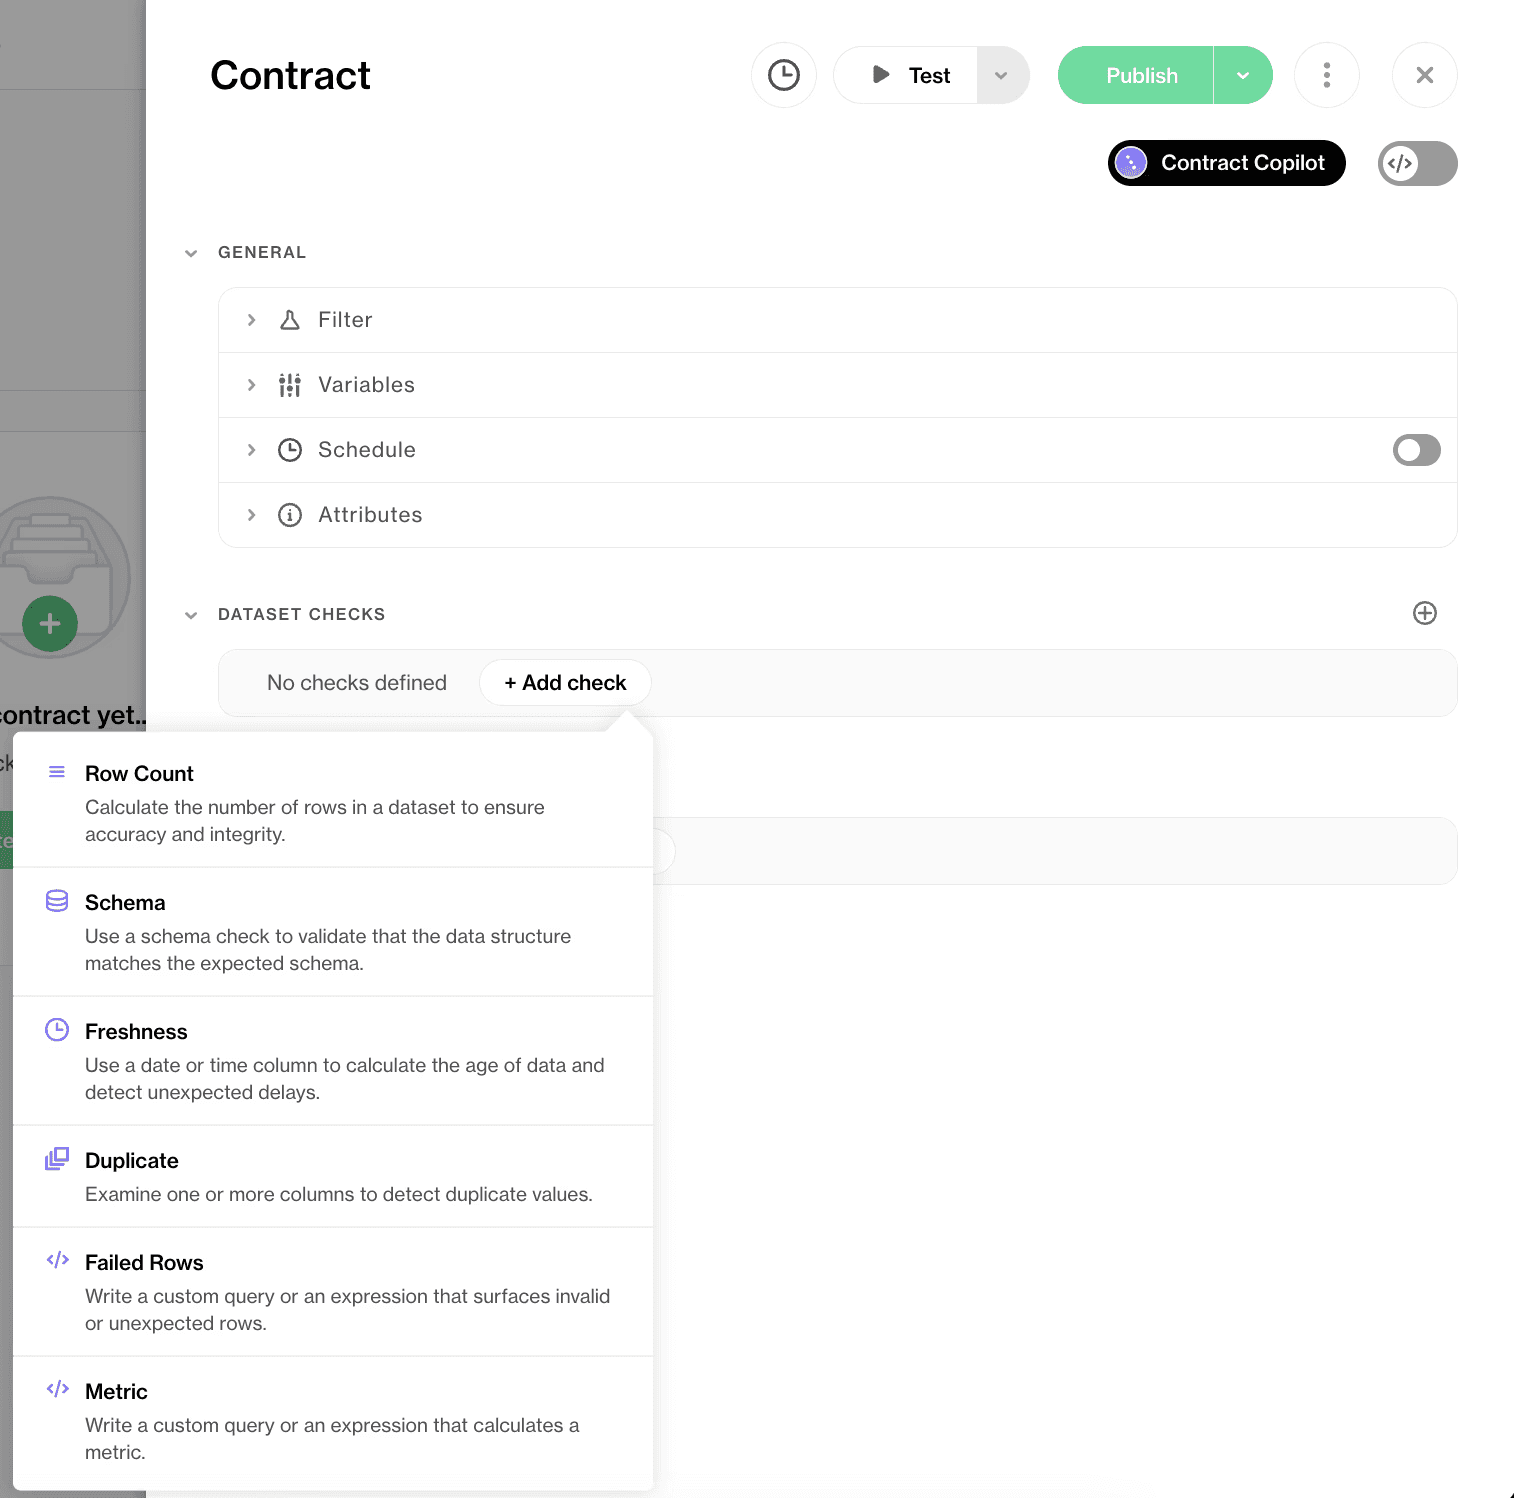
Schema, rules, freshness, threshold levels—everything about your dataset can be monitored and verified using the contracts. When the data changes, the contract verifies it automatically, and both sides, technical and business, see the result.
If necessary, Contract Copilot converts plain-English rules into executable checks, so the steward doesn't need to write SQL to codify a policy.
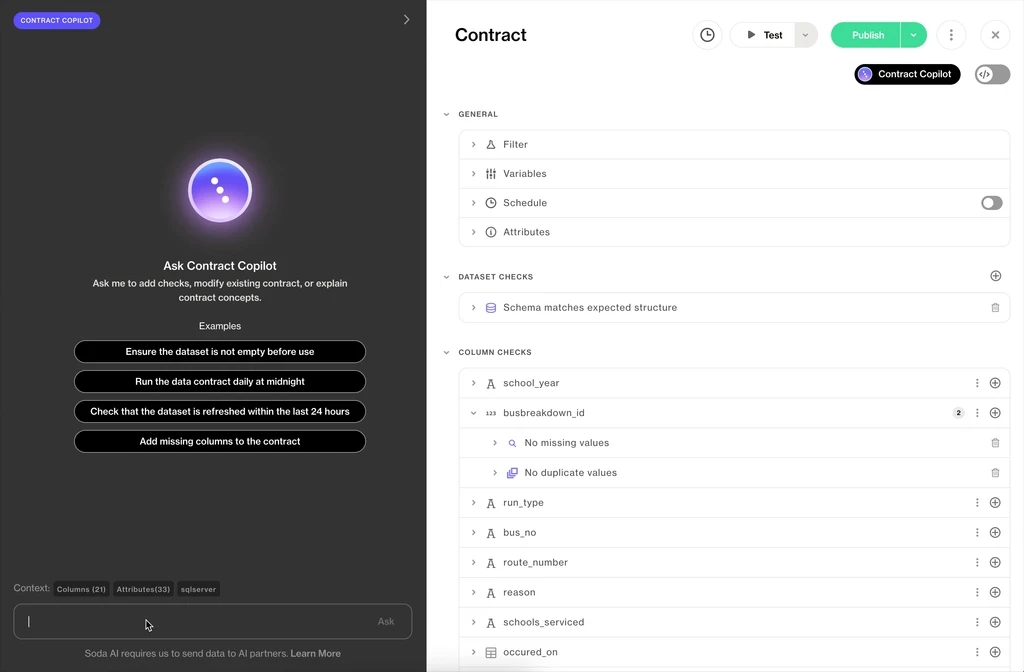
Every UI change has a synced YAML counterpart that the responsible data engineer reviews and approves before deployment. Stewards define, engineers approve, both from the same artifact.
Understand: Investigate Issues with Full Context
Investigating an Anomaly: Incident Management
Data quality issues arrive from scattered sources: dashboards, Slack threads, ad hoc reports, and pipeline failures. Each one arrives with limited context and threatens to spread to other systems.
Without a single workflow, stewards end up asking "Did this start today?" or "Who touched this table?" — and spend more time reconstructing the timeline than resolving the issue.
Soda has a single-window workflow for this entire process. When the anomaly detection model highlights an unusual metric value, you see the signal immediately in red on the time series.
Check out this video tutorial on Incident Management |
One click opens a detail panel with the metric, the values involved, and the historical trend out of which the anomaly has sprung up. If the behavior aligns with known patterns or business activity, you mark the point as expected. The model learns from that feedback and adjusts its understanding of your data rhythms.
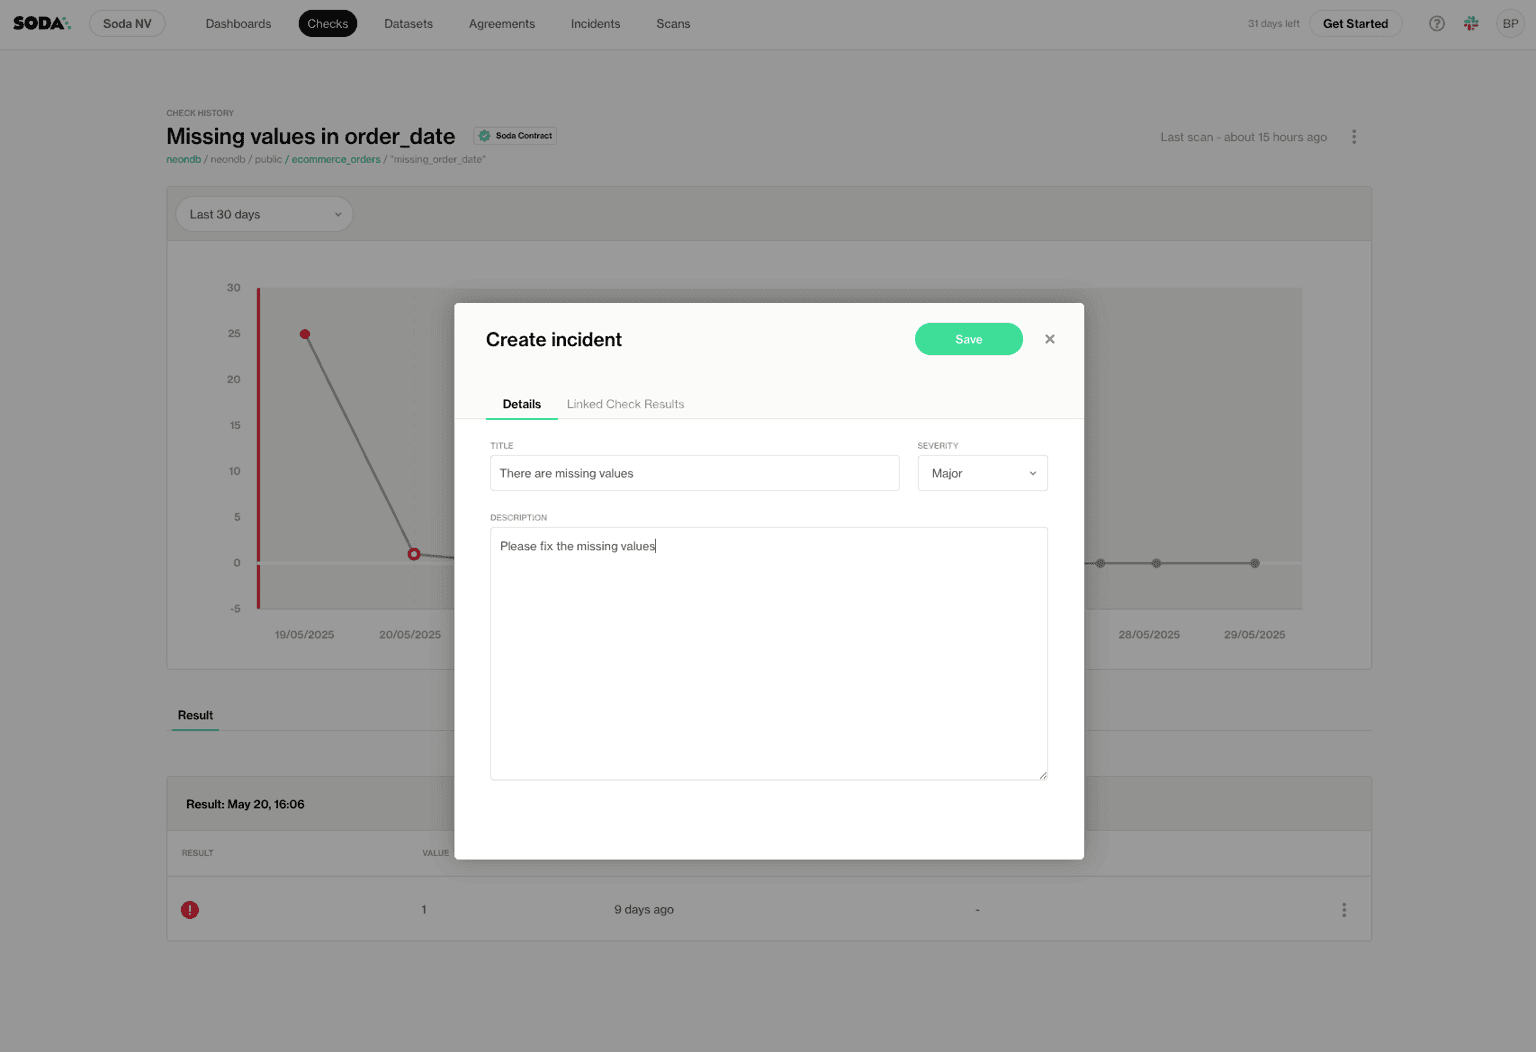
If the point requires deeper investigation, you create an incident directly from the same panel. The incident form opens with the essential fields: title, description, and linked dataset context. Soda records who reported it, when it occurred, and which check or metric triggered it.
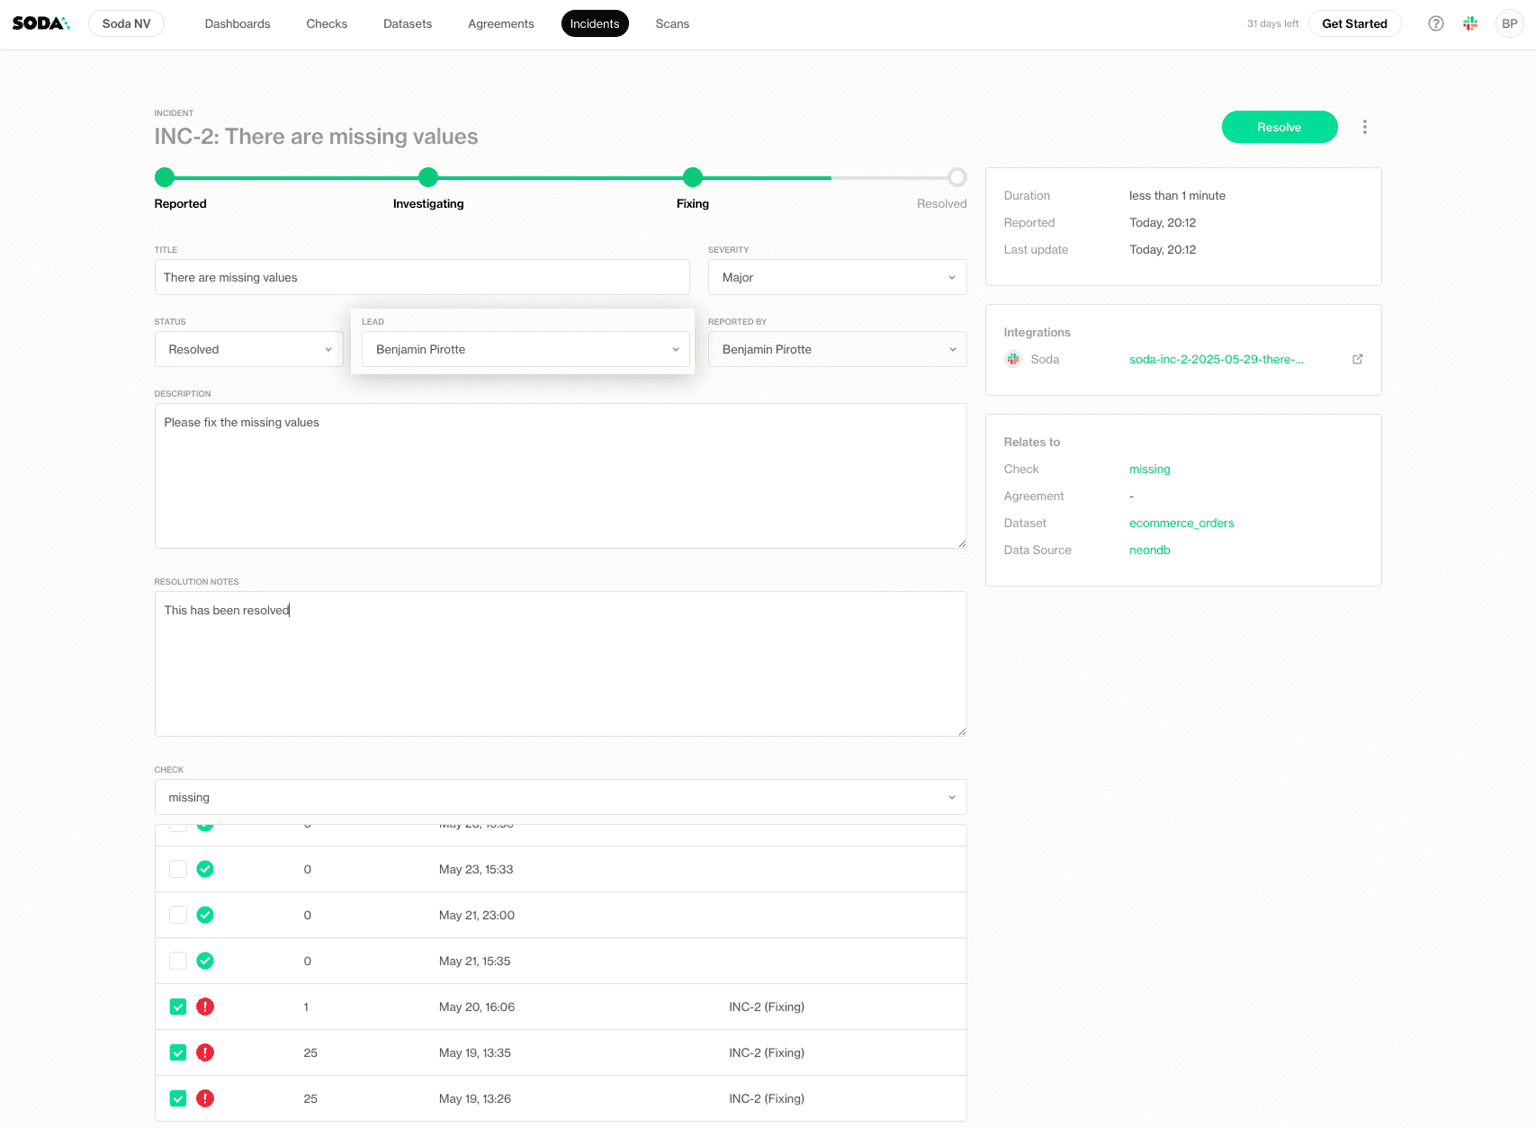
The entire chain stays intact, and this structure replaces the ad hoc investigations that usually hide in chats.
You can also continue the workflow in the Incidents tab, where you can assign a lead, define severity, and set the status. Slack, Jira, and Teams integrations extend the workflow further.
Fix: Resolve at Source
Prioritizing and Remediating Issues: Soda Cleanse
Soda built agentic data cleansing on top of the same platform that powers data contracts and observability.
Specialized AI agents analyze the failed records, identify the failure pattern, and generate targeted fix recommendations. Users’ approval and rejection trains the agents and the loop runs continuously:
Ingest
Soda Cleanse pulls failed records as Issues and assigns the right specialized agent to each failure type automatically. Each agent is purpose-built for its category:
Normalization agent: maps variant spellings of the same entity to a canonical name.
Imputation agent: reads the contract's derivation logic and proposes fills for missing records.
Deduplication agent: identifies candidate pairs and picks the most likely correct record using interpretable heuristics; LLMs only step in for ambiguous cases.
Reconciliation agent: surfaces conflicts across source systems, references the contract's source-of-truth rule, and proposes the canonical value.
These failure types show up everywhere: variant counterparty names in finance, duplicate accounts in CRM, missing fields in customer master, cross-system conflicts between ERP and warehouse. Same agents, different domains.
Propose
The steward's Inbox shows a suggested fix for each record with row context, the agent's confidence score, and plain-language reasoning.
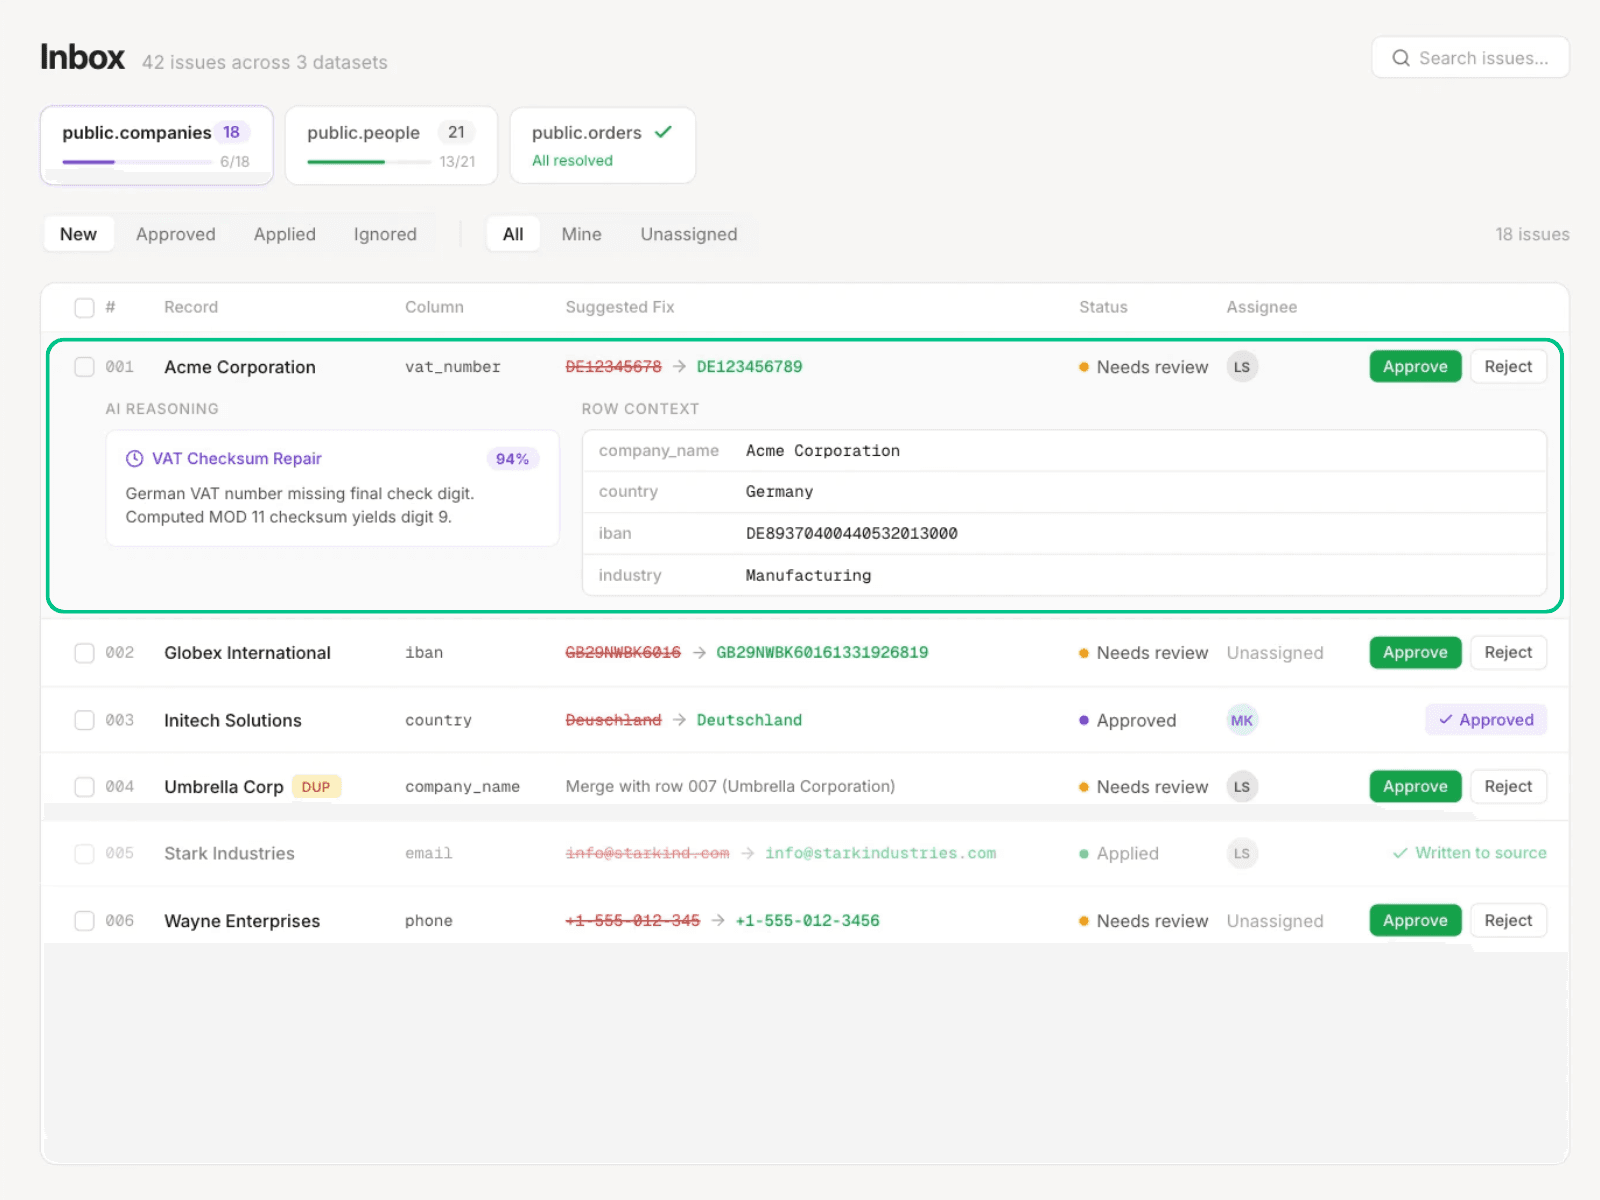
Approve
The steward approves, rejects, or modifies every proposed fix. Approved fixes write back to source (or to a Cleanse-managed staging table if the team isn't ready for direct write-back). Nothing changes without steward sign-off, and every decision lands in the audit trail. High-confidence fixes can be bulk-approved; low-confidence ones are reviewed individually. The steward sets where the line sits.
Every approve, reject, and edit signal trains the agents. Over time, the steward sees fewer low-confidence cards in the Inbox.
For a deeper walkthrough of the mechanics, see how Soda Cleanse works.
What Changes for the Steward
Working inside Soda compresses the steward's day at every step.
The steward workflow shown above isn't tied to one industry or data maturity level. Any organization with critical data elements and named owners — stewards, record owners, or business leads accountable for a domain — will recognize the same pressure points: definitions drifting, incidents piling up in Slack, engineers inheriting governance work they didn't sign up for, audit evidence assembled by hand.
The day inside Soda runs on one workflow — find, understand, fix — with an audit trail that's already written by the time the work is done. No spreadsheet relay, no engineering ticket queue, no audit evidence to reassemble at month-end.
If you're a data steward, record owner, or business lead tired of being the manual middleman between detection and fix, book a demo to walk through it with your team's data.
Frequently Asked Questions
How long does it take to onboard a dataset in Soda?
Most stewards onboard their first dataset and configure checks in under an hour using the no-code UI. On onboarding, Soda auto-reconstructs a year of dataset history, so baselines and trend ranges are visible before the first new scan runs. Engineer review of the synced YAML contract typically happens the same day or next, depending on team cadence.
Can stewards use Soda without writing code?
Yes. The no-code UI lets stewards define checks, configure threshold strategy and sensitivity, and propose contracts using point-and-click. Contract Copilot converts plain-English rules into executable checks. The synced YAML is what engineers review and approve, so stewards never need to touch it directly.
What happens when an anomaly is flagged but turns out to be expected behavior?
The steward marks the point as expected from the detail panel, and the model learns from that feedback to refine its understanding of the dataset's rhythm. False positives drop over time as pattern recognition adapts to seasonal cycles, business events, and known variations specific to your data.
Do stewards need to review every failed record individually?
No. High-confidence agent recommendations can be approved in bulk, and the steward sets the confidence threshold. Low-confidence proposals are routed for individual review with side-by-side evidence cards.
Can Soda handle regulated-industry audit requirements?
Yes. Soda supports SOC 2 Type II compliance and self-hosted deployment for finance, healthcare, and government contexts where data residency and immutable evidence are non-negotiable.


