What Is Data Observability? 5 Pillars + How to Implement It
What Is Data Observability? 5 Pillars + How to Implement It
What Is Data Observability? 5 Pillars + How to Implement It

Fabiana Ferraz
Fabiana Ferraz
Technical Writer at Soda
Technical Writer at Soda
Table of Contents
Every data team runs into it eventually. A number does not match expectations, a metric cannot be traced with confidence, or a model's performance begins to drift without a clear explanation.
Data issues are a natural part of working with complex and constantly evolving systems, where changes in source data, transformations, or dependencies introduce unexpected problems. The real challenge is not that data breaks. It is that teams often lack timely visibility into when it breaks and why.
Without that visibility, issues move downstream into dashboards, models, and business processes before anyone has the context to respond effectively. Data observability provides continuous, automated insight into the health of your data systems at scale, so teams can detect, diagnose, and resolve issues before they impact decisions.
Data observability is usually commonly by five pillars:
Together, they tell you whether your data is arriving on time, looking the way it should, and behaving as expected.
In this guide, you'll find a breakdown of each pillar, a clear look at data observability tools worth knowing, and an implementation roadmap you can bring to your team.
Key Takeaways |
|---|
|
What is Data Observability?
Data observability is the practice of continuously monitoring data systems so problems are caught and explained before they impact downstream consumers. It applies the metrics-logs-traces principle of software observability to pipelines and datasets, surfacing freshness, volume, distribution, schema, and lineage signals that infrastructure monitoring alone cannot see. The result is faster detection, faster root cause, and fewer surprises in dashboards and models.
Software engineers solved a version of this problem years ago. When a service goes down, they don't manually inspect servers hoping to find the cause. They have metrics, logs, and traces that tell them exactly what's wrong and where. That practice is called observability, and it's been standard in software development for decades.
Data teams are applying the same thinking to their data pipelines and datasets: monitor continuously, detect problems the moment they develop, and surface enough context for your team to act fast, before downstream consumers ever feel the impact.
The reason this matters comes down to how complex data systems have become. A single pipeline can touch dozens of tables across multiple systems before a report ever gets generated, and any one of those layers can fail without warning.
Data incidents are routine in any complex pipeline, and each one takes meaningful engineering time to resolve. As data architectures sprawl across cloud warehouses, streaming pipelines, real-time transformations, and now GenAI and agentic AI systems, maintaining a holistic view of data health has become one of the most pervasive challenges data teams face.
That's not a staffing problem. It's a visibility problem, and a solid data observability practice is built to address exactly that.
The Five Pillars (with examples + metrics)
The five pillars cover the most important dimensions of data health: freshness tells you whether data arrived on time, volume tracks whether the right amount arrived, distribution flags shifts in the data's statistical shape, schema catches structural changes, and lineage maps the blast radius.
Together they convert "is something wrong with the data?" into a specific, actionable signal — and they're the foundation every observability tool, including Soda, builds on.
1. Freshness
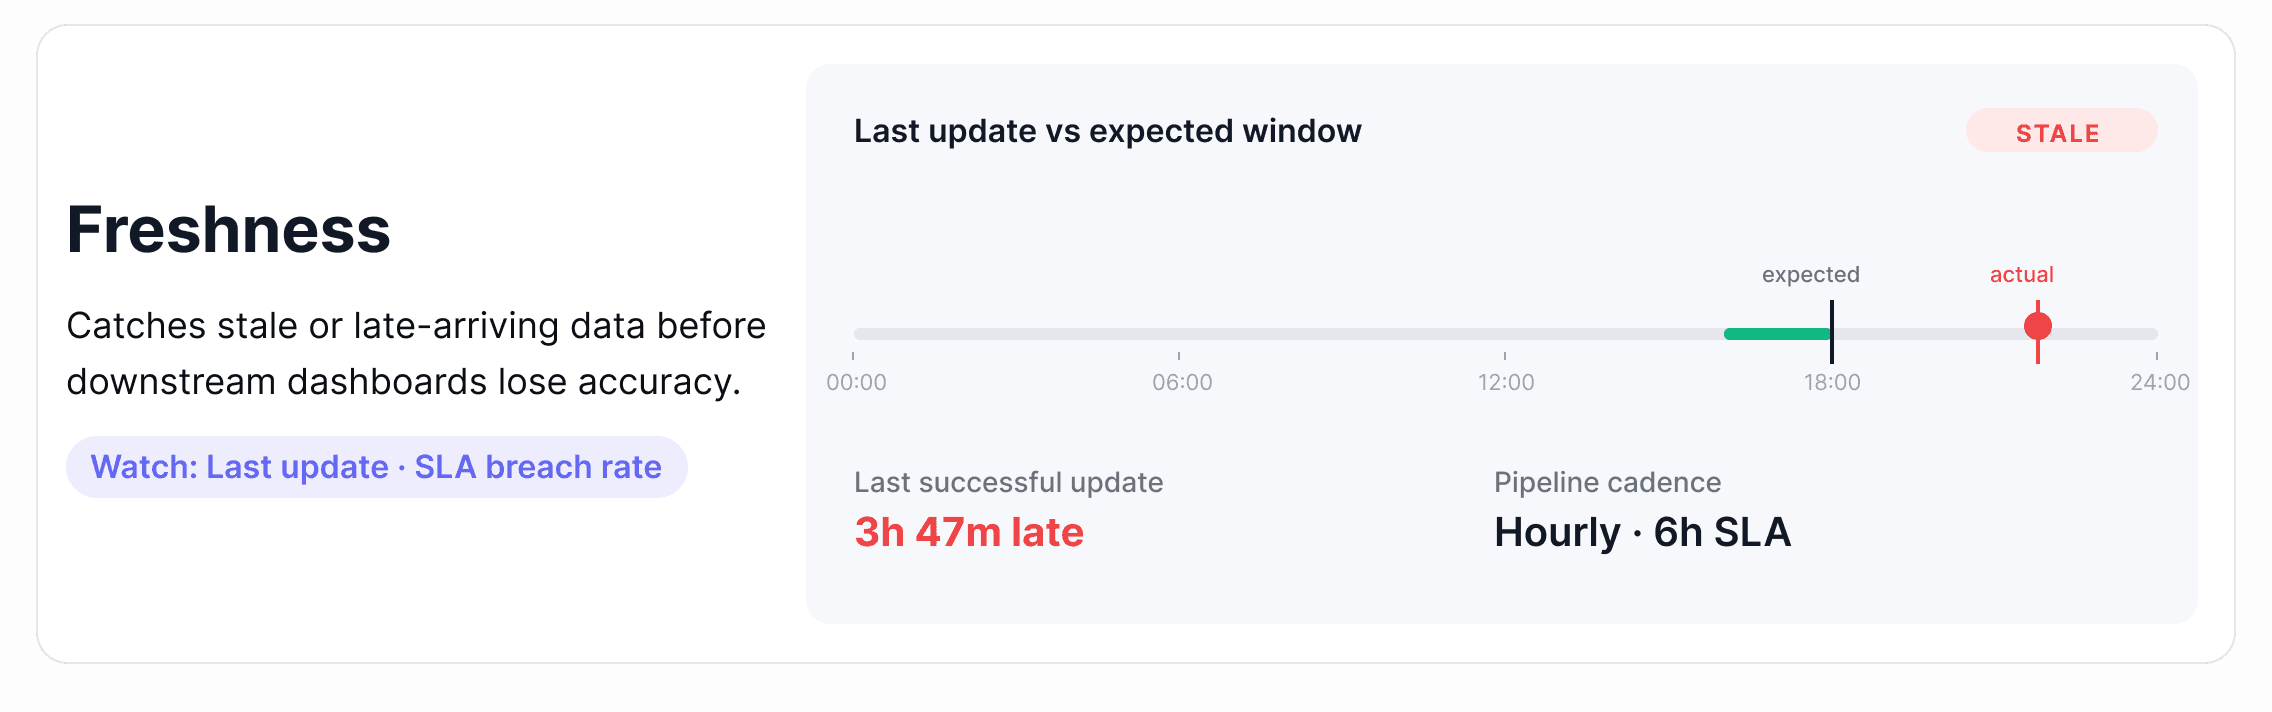
Freshness measures whether data arrived when it was supposed to. Every dataset has an implied or explicit update schedule (hourly, daily, or after a pipeline run), and freshness tracking tells you whether that schedule is being met.
Where it breaks down: A pipeline runs but takes longer than expected, or it fails without raising an error and stops updating a table entirely. Downstream dashboards continue loading, but they're showing data from yesterday or last week. Nobody notices until a business decision has already been made on stale numbers.
Metrics to watch:
Time since last record insert
Gap between expected and actual update time
SLA breach rate over rolling windows (7-day, 30-day)
Alert tip: Set freshness thresholds relative to your pipeline's expected cadence, not a fixed window. A table that updates every 6 hours should alert at 7 hours, not 24. The tighter the SLA, the tighter the threshold.
How this looks in practice: Effective freshness monitoring reads warehouse metadata (most-recent-insert timestamps, partition load times, or commit logs) rather than scanning rows. That keeps coverage cheap enough to apply across thousands of tables. Once a baseline forms from historical update times, the platform surfaces any update that lands outside the expected window and routes the alert to the team that owns the pipeline.
2. Volume
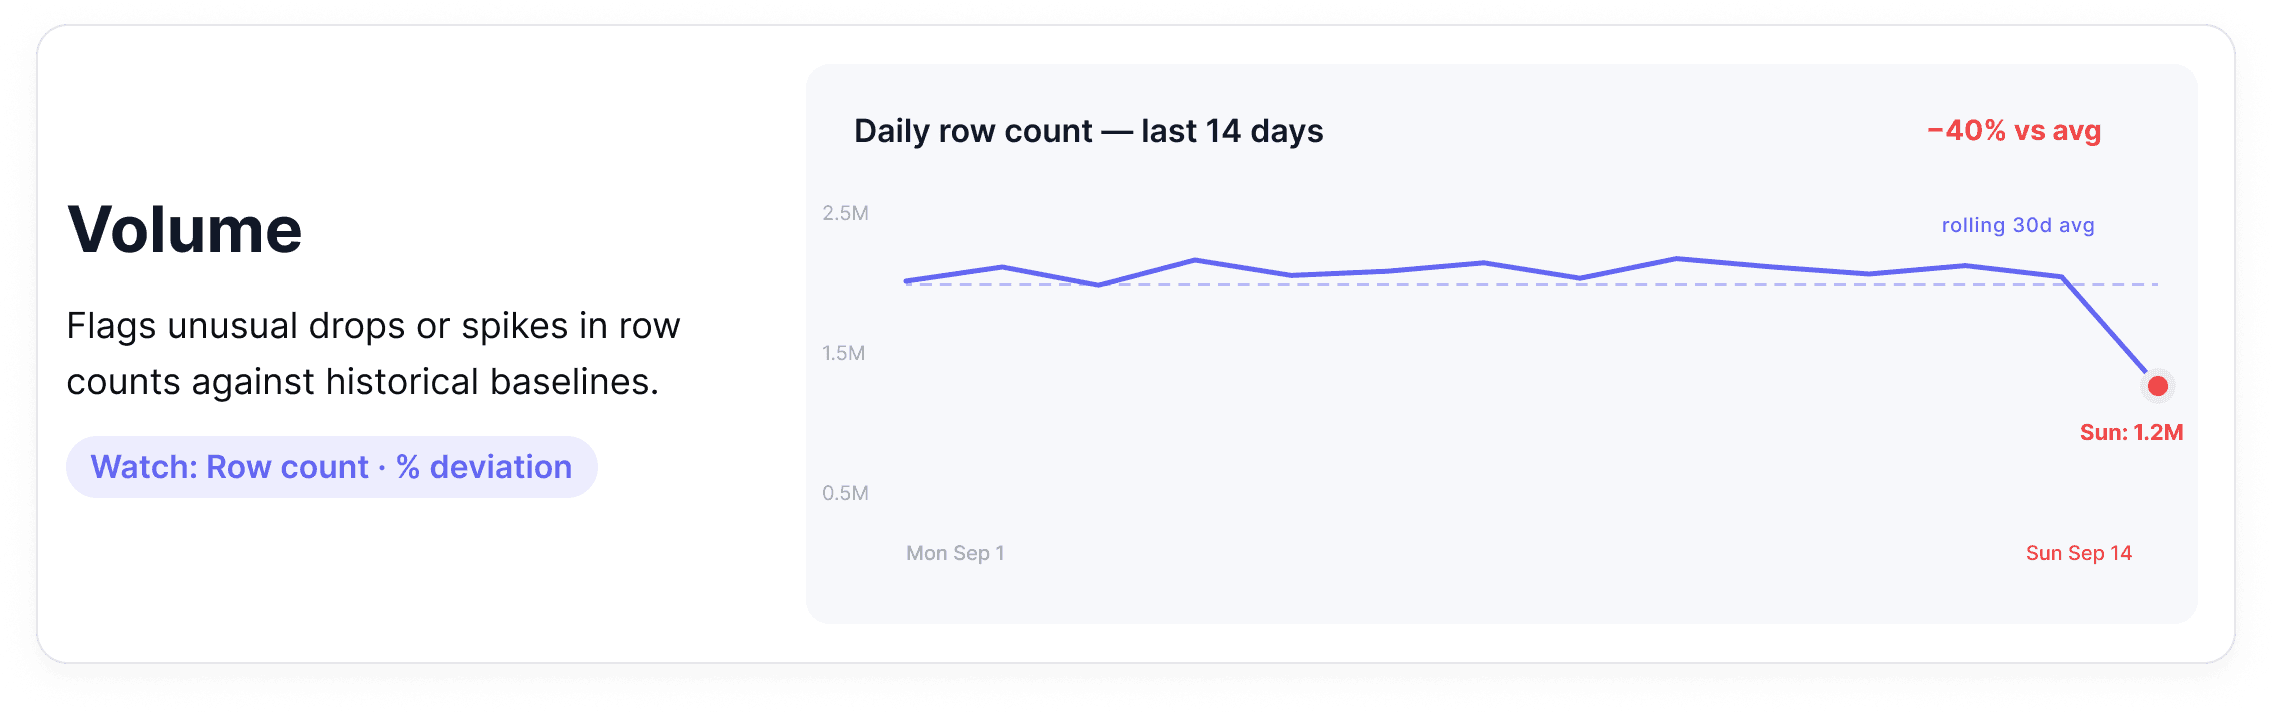
Volume monitoring tracks how many rows are arriving in a dataset over time. It establishes a baseline (how much data normally flows through) and flags meaningful deviations in either direction.
Where it breaks down: A daily partition loads with 40% fewer rows than usual. Or a deduplication job runs incorrectly and row counts double overnight. Both are real incidents, and neither will surface in a system that only monitors infrastructure health.
Metrics to watch
Row count per table, per partition, per time window
Percentage change versus rolling average
Missing partition detection
Alert tip: Use relative thresholds rather than absolute ones. A table that normally receives 2 million rows should alert on a 15-20% deviation because baseline volumes shift naturally as your business grows.
How this looks in practice: Volume monitoring works by reading row count metadata and partition manifests from the warehouse rather than running full table scans. The platform tracks a rolling historical baseline for each table and flags deviations that fall outside the expected range without requiring anyone to predefine what "normal" looks like. As business volumes grow, the baseline adapts automatically, so alerts stay meaningful rather than becoming chronic noise.
3. Distribution
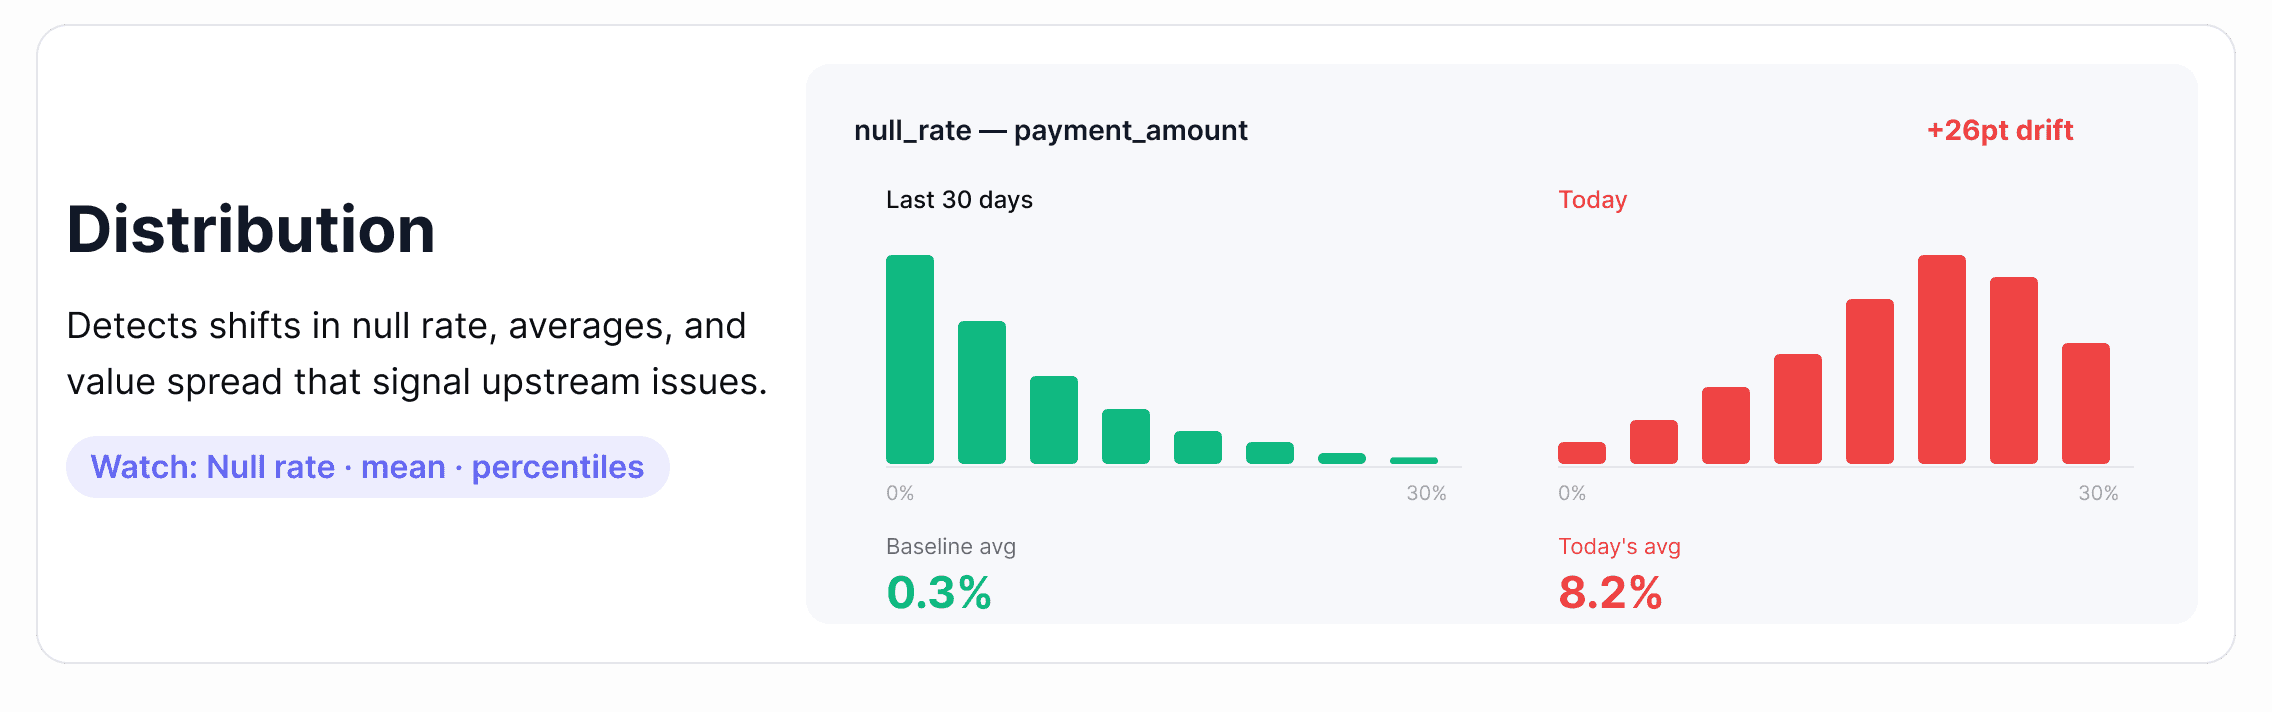
Distribution monitoring looks at the statistical shape of your data: the spread of data values, null rates, averages, and percentiles and flags when that shape changes in ways that suggest something has gone wrong upstream.
Where it breaks down: A payment_amount column starts showing an unusual spike in null values. An age field starts skewing toward implausible values after an upstream schema migration. A recommendation model starts producing worse outputs because the feature distributions it was trained on have quietly shifted. Distribution failures are some of the hardest to detect without automated monitoring.
Metrics to watch
Null rate and uniqueness rate per column
Mean, median, standard deviation
Percentile distributions (p50, p90, p99)
Value frequency changes for categorical columns
Alert tip: Static thresholds work poorly here. Distribution drift is subtle and gradual — the kind of thing that looks fine at any single point in time but is clearly wrong over a 30-day view. Anomaly detection for data, which learns your data's historical patterns and adapts as baselines shift, is significantly more reliable than hand-tuned rules for this pillar.
How this looks in practice: Distribution monitoring depends on profiling — a scheduled lightweight scan that captures column-level statistics like null rate, mean, median, percentiles, and frequent values, then tracks how each evolves. Single-metric anomaly detection catches obvious shifts; multivariate detection catches correlated drift across multiple columns at once, which is the failure mode that breaks ML pipelines silently. For columns with naturally skewed distributions, look for tools that adapt the baseline to the column's actual shape rather than applying static bounds.
4. Schema
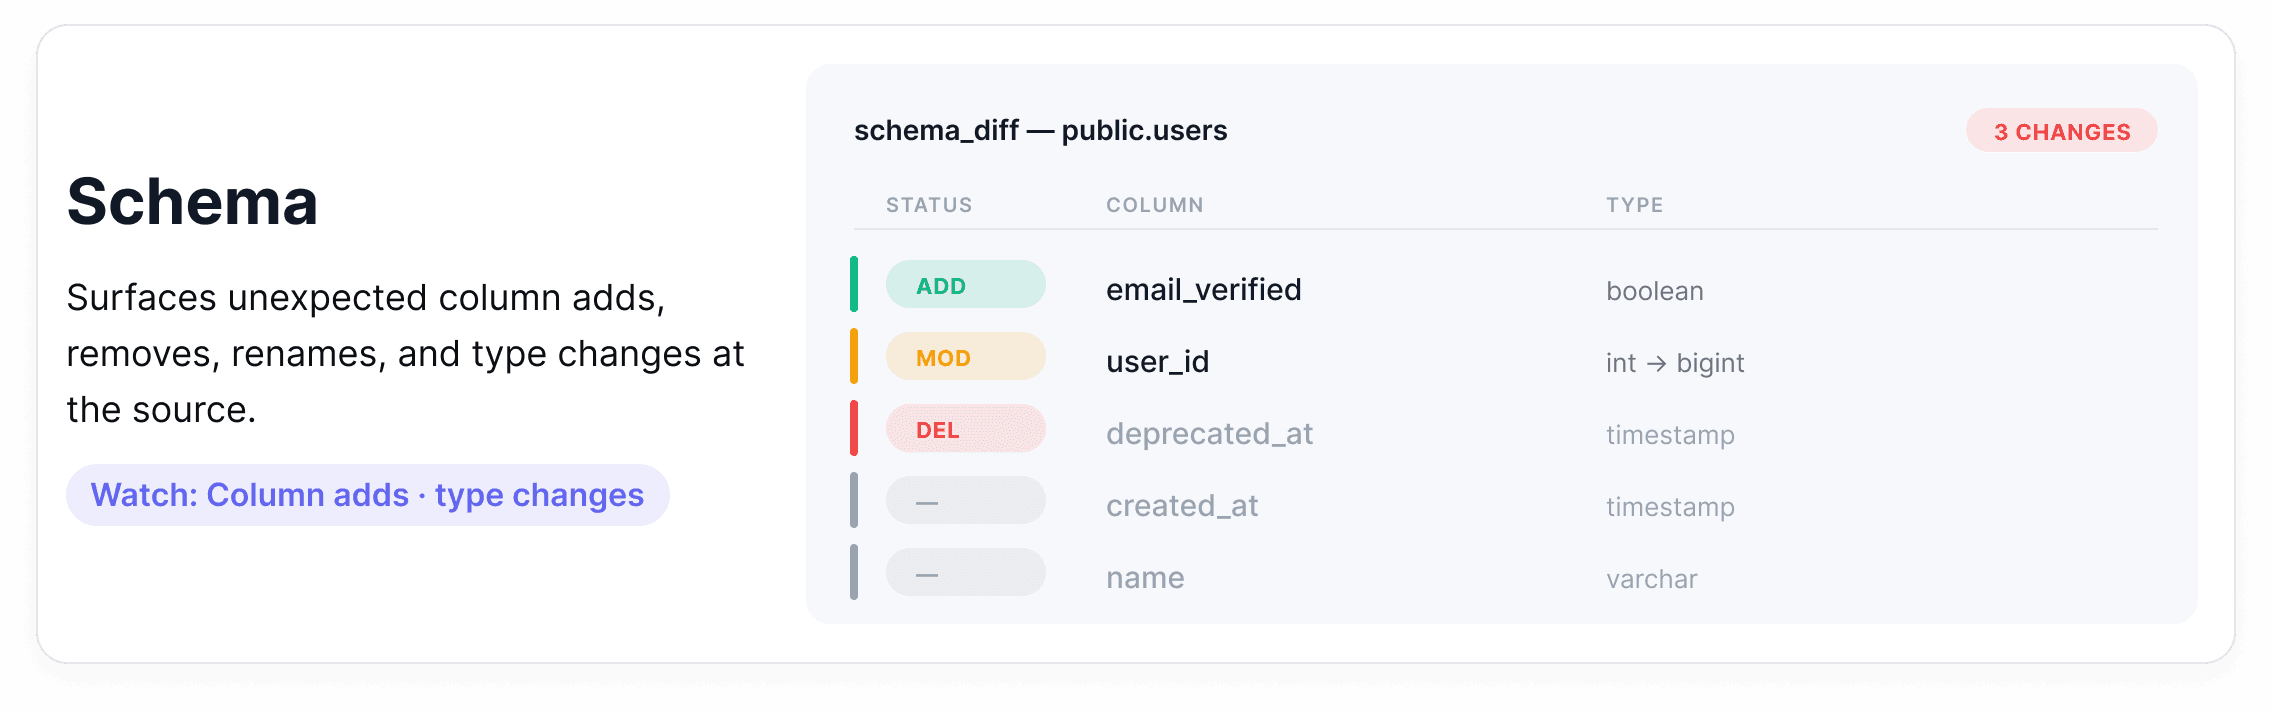
Schema monitoring tracks the structure of your datasets, including column names, data types, and required fields and alerts when that structure changes unexpectedly.
Where it breaks down: An upstream team renames a column. A new data type gets introduced. A required field gets dropped from an API response. None of these generates errors at the infrastructure level, but each one can break every downstream process that depended on that column existing, being named correctly, or containing a specific type.
Metrics to watch
Column additions and removals
Data type changes
Nullable vs. non-nullable field changes
Column rename detection
Alert tip: The goal isn't to block all schema changes because some are intentional improvements. It's to make sure the right people know when a change happens before it propagates downstream. Route schema alerts to both the engineering team and the downstream consumers of that table.
How this looks in practice: Schema observability runs against catalog metadata (column names, types, nullability), diffing successive snapshots rather than scanning rows. That keeps coverage cheap enough to apply across thousands of tables. Not every change carries the same risk: an added column is informational, a widened type usually flows through cleanly, but a renamed column is the dangerous case. Downstream queries keep running and quietly return nulls until someone notices a week later that a dashboard looks off. What makes schema observability useful is how short it can make that detection window.
5. Lineage
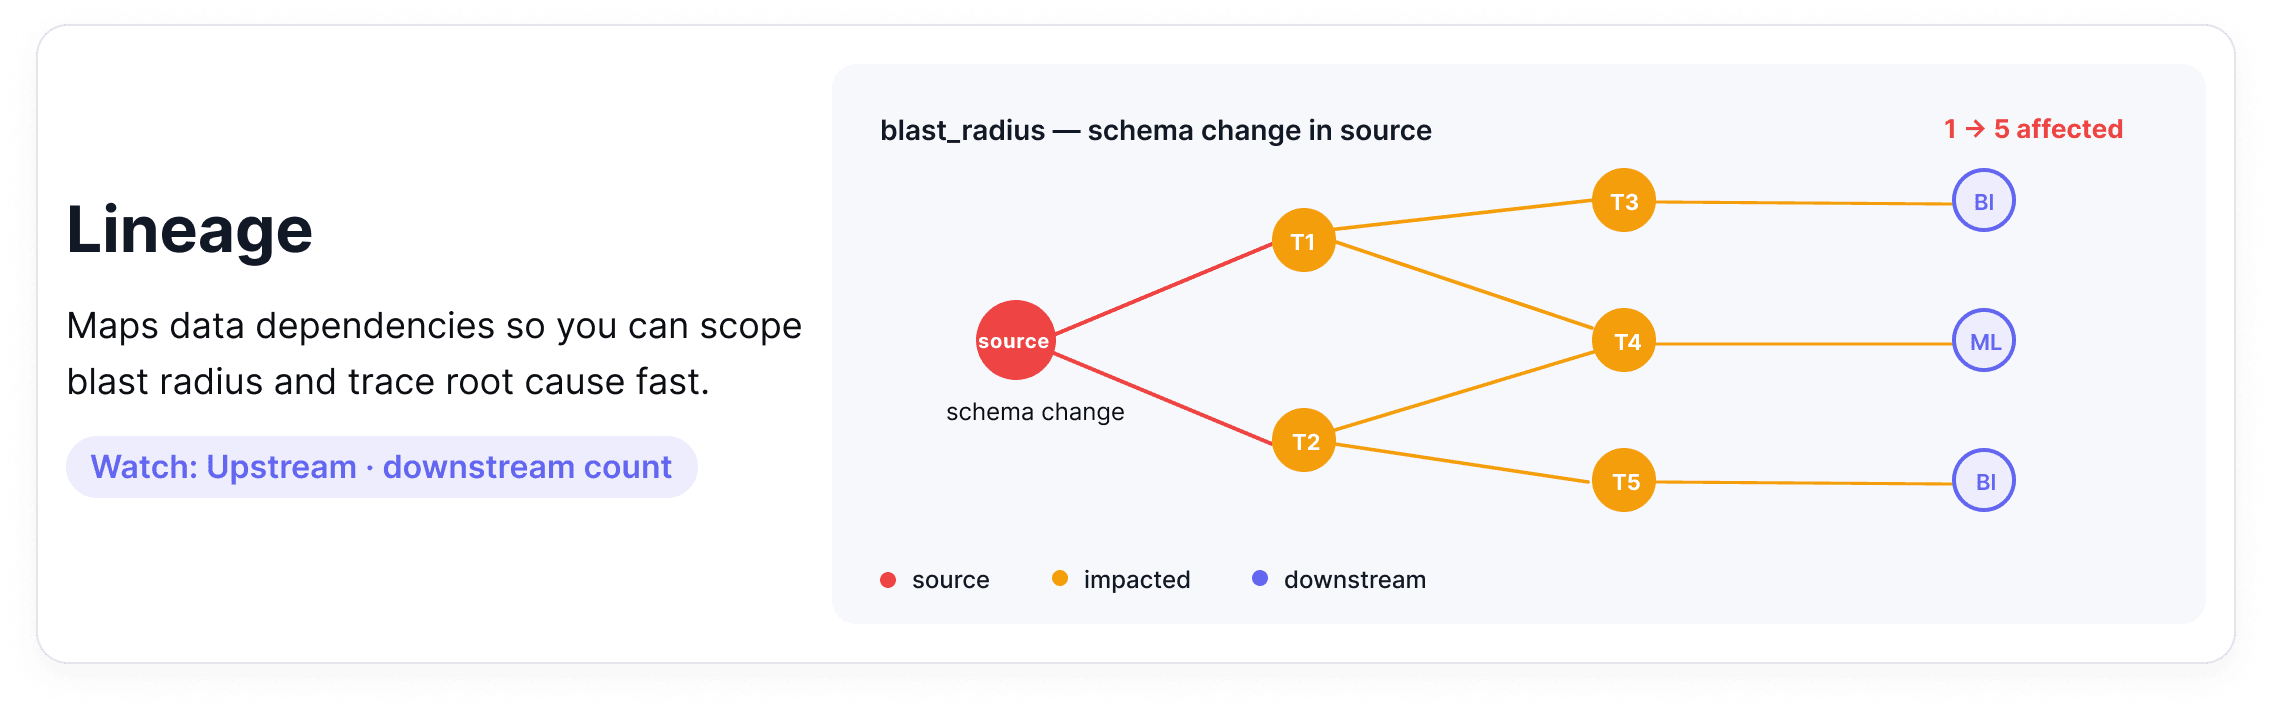
Data lineage maps the full journey of your data from source systems through transformations, joins, and aggregations, all the way to the dashboards and models that consume it. When something breaks, lineage tells you where it started and everything it affected.
Where it breaks down: A schema change in a source table causes a downstream aggregation to fail silently. Three reports and one ML model are now producing wrong outputs. Without lineage, finding all of them requires manually tracing every dependency. A single upstream schema change can create a freshness problem one table downstream, a distribution problem two tables downstream, and a broken report the marketing team is using to make decisions.
Metrics to watch
Upstream dependency count per dataset
Downstream consumer count (your blast radius)
Time-to-detect propagation of an upstream issue
Alert tip: Use lineage to scope your incident response, not just to debug after the fact. When a freshness or volume alert fires, your first question should be: what depends on this table? A lineage graph answers that immediately and helps you prioritize which downstream teams to notify first.
How this looks in practice: Data lineage is captured from query logs, transformation code, and BI tool dependencies, then stitched into a dependency graph that maps each dataset to its upstream sources and downstream consumers. Most teams source this from a dedicated lineage tool or their orchestrator rather than building it by hand.
What makes lineage useful in an observability context is how it connects to the other four pillars: a freshness alert upstream becomes a list of affected dashboards, a schema change becomes a list of consumers to notify, a distribution drift becomes a question of which model to retrain first. Lineage makes those connections visible.
Data Observability vs Data Testing (And Why You Need Both)
There can be some confusion around these two approaches, so it's worth pausing to separate them properly because confusing them leads to real gaps in how teams protect their data.
Data testing asks: Does this data meet the rules we've defined? Is the customer_id field unique? Are there nulls in a column that should never be empty? Are these revenue figures within an expected range? Answering those questions requires explicit, predefined checks that encode a known expectation and fail when reality doesn't match.
Data observability works differently. Rather than validating data against predefined rules, it watches how your data behaves over time and flags when something looks off, even if you never thought to write a rule for it. A table that normally receives 2 million rows arrives with 800,000. A column's average shifts by 30% overnight. A pipeline that usually completes in 20 minutes is now running for 3 hours. To be detected, these issues require context, history, and continuous data quality monitoring.
A useful way to hold the distinction: Data testing catches known knowns. Data observability catches unknown unknowns.
Data Observability | Data Testing | |
|---|---|---|
Approach | Reactive and adaptive | Proactive and preventative |
When it runs | In production, runtime monitoring | Pre-production, during development or CI/CD |
What it does | Monitors data behavior and changes over time; detects anomalies, schema changes, and unexpected issues | Validates known rules and enforces contracts |
What it catches | Unknown unknowns — deviations no one thought to write a rule for | Known knowns — failures you've defined a rule for |
Configuration | Adaptive — baselines learned from historical data | Explicit, per-check (you write the rule) |
Output when it fires | Signal (something looks unusual; investigate) | Certainty (rule failed) |
Example | Row count dropped 40% overnight without anyone configuring a 40% threshold |
|
Neither is sufficient on its own. Observability gives you a broad, immediate signal across your entire data estate with almost no configuration. It's the fastest way to get coverage and start learning where your data is fragile. Testing gives you precision. When a check fails, you know with certainty that something is wrong, not just that something looks unusual.
The practical implication: start with observability to get coverage fast. Then use those signals to invest in tests and data contracts for the datasets that matter most.
Observability surfaces where tests are needed; tests reduce the noise that observability has to look through.
Framing observability vs. testing as a competition misses the point. The teams that get the most out of their data use both deliberately, at different stages, for different purposes.
Ready to see what observability looks like in practice? Book a demo to see Soda Cloud in action.
How Do You Implement Data Observability? (Step-by-Step)
Knowing where to start on a real data stack, with real constraints, limited engineering time, and dozens of equally important tables, is half the challenge. This roadmap is designed to be sequential. Each step builds on the last, and you don't need to complete all seven before you start seeing value. Most teams have meaningful coverage by step four.
Identify what matters, define what "healthy" looks like, instrument the signals, let baselines form, route alerts thoughtfully, build a triage workflow, and close the loop with prevention.
Step 1: Identify Your Tier 1 Assets
Before instrumenting anything, get clear on what actually matters. Tier 1 data assets are the datasets and pipelines your business depends on most directly: executive dashboards, revenue reporting tables, customer-facing data products, and any datasets feeding machine learning models in production.
Useful test: if this table was wrong for 24 hours, who would notice and what would break? If the answer involves a board meeting, a customer SLA, or a production ML model, it's Tier 1.
Start there and work outward. Most teams find they have somewhere between 10 and 30 genuinely critical datasets, which is a manageable scope for getting first coverage in place quickly.
Step 2: Define Your SLAs and SLOs
Once you know what to protect, define what "healthy" actually means for each asset. Set explicit Service Level Agreements (SLAs) and Service Level Objectives (SLOs) for the metrics that matter most.
For freshness: when does this table need to be updated, and how often?
For completeness: what's the maximum acceptable null rate for critical columns?
For volume: what deviation from baseline warrants an alert?
Writing these down forces a useful conversation between data engineers and the business stakeholders who consume the data. The outcome is a shared definition of done — not just for building pipelines, but for maintaining them.
In regulated industries, compliance frameworks may drive many of these standards. Read more about Closing the BCBS 239 data quality gap with Soda.
Step 3: Instrument Your Signals
With your Tier 1 assets identified and SLOs defined, connect your data sources and let observability begin collecting metadata signals: row counts, schema snapshots, freshness timestamps, null rates, and distribution statistics.
One of the practical advantages of a modern data observability platform is that this step requires almost no manual configuration per table. Monitoring applies at the data source level and extends automatically to every dataset underneath, meaning you can get coverage across hundreds of tables in minutes, not weeks. If you have pipeline logs and job metadata available, bring those in too. The more signals you have early, the faster baselines form.
Step 4: Establish Behavioral Baselines
Anomaly detection only works if the system understands what "normal" looks like. During this phase, your observability layer learns the historical patterns of your data, including typical row count ranges, expected freshness windows, and normal distribution shapes, and uses that context to distinguish genuine issues from expected variation.
With built-in backfilling, you don't have to wait weeks for baselines to form. Historical metadata is analyzed from the moment observability is enabled, so the algorithm can start detecting meaningful deviations right away rather than producing noisy alerts during a warmup period.
Plan to spend a few weeks reviewing early alerts, flagging false positives, and refining thresholds. Tighten the freshness window on a table that was slow to alert, add distribution monitoring to a column that turned out to be fragile, adjust the volume deviation threshold for a partition that sees predictable seasonal swings.
2K Games migrated from rule-based checks and saw alert volume drop materially as Soda's anomaly detection adapted to their per-dataset baselines. Read the full case study.
Step 5: Build an Alerting Strategy That People Will Actually Follow
An alerting setup that pages everyone for everything quickly trains people to ignore it. The goal is the right alert, reaching the right person, through the right channel, with enough context to act.
A tiered approach works well: critical freshness or volume failures on Tier 1 assets go directly to PagerDuty or as a high-priority Slack message to the on-call engineer. Distribution drift or schema warnings on secondary tables go to Jira as tracked issues. Lower-priority signals get batched into a daily digest for the data team to review together.
Step 6: Create a Triage Workflow
When an alert fires, ambiguity about who owns it or what to do first costs time you don't have. A lightweight triage workflow solves this before incidents happen, instead of during them.
At minimum, every Tier 1 dataset should have a designated owner, a clear escalation path, and a short runbook, which is a documented set of first-response steps specific to that dataset. What are the most likely causes of a freshness failure here? Which upstream tables should you check first? Who needs to be notified if it's not resolved within an hour?
Lineage context is particularly valuable at this stage. When an alert fires on a downstream table, being able to immediately see what feeds it and trace the issue back to its source cuts resolution time significantly.
Step 7: Close the Loop With Prevention
Observability tells you when something went wrong. The prevention loop is about making sure the same thing doesn't go wrong again.
Each incident leaves behind useful information: which signal fired, how far the issue propagated, and how long it took to detect. The next move is to shift it left: encode it as an explicit check and run it earlier in the pipeline, so known failures don’t reach production again.
Data contracts formalize this approach, creating a structured agreement between data producers and consumers that defines what a dataset should look like and enforces those standards every time new data arrives.
Where observability is automatic and metadata-driven, contracts are explicit and rule-driven.
Example using Soda Contract Language:
dataset: warehouse/prod/public/orders

checks:
  - schema:
      allow_extra_columns: false
  - freshness:
      column: order_datetime
      threshold:
        unit: hour
        must_be_less_than: 6
  - row_count:
      threshold:
        must_be_greater_than: 0
Discover how the AI automation platform Make embedded Soda data contracts at ingestion and transformation to catch issues before they reach dashboards.
The roadmap doesn't end here; it cycles. New datasets get onboarded, new SLOs get defined, and new incidents lead to new tests. That's not a sign the system is failing. It's a sign it's working.
What to Look for in Data Observability Tools and Platforms
Gartner's Market Guide for Data Observability Tools names four key features every platform should deliver: monitoring and detection, alerting and triage, data lineage and impact analysis, and root cause analysis — plus extensibility across your stack as a mandatory enabler.
However, choosing a platform built for end-to-end data observability is less about features on a checklist and more about whether the tool fits how your team actually works: your stack, your scale, and the way incidents get handled. Here's what to evaluate before deciding.
Stack Coverage: Does It Connect to Your Entire Ecosystem?
A data issue rarely starts and ends in one place. It might originate in an upstream API, travel through a dbt transformation, land in Snowflake, and break a Tableau dashboard that three teams depend on.
A data observability tool that only connects to your warehouse gives you a partial picture at best. The goal is a platform that slots into your existing workflow rather than creating a parallel one.
Soda offers native integrations across every layer: data sources and warehouses (Snowflake, Databricks, BigQuery, Redshift, Postgres), orchestrators (dbt, Dagster, Prefect, Airflow), BI tools (Looker, Tableau, Power BI), and your team's existing alerting and ticketing setup (Slack, Jira, PagerDuty, ServiceNow).
Monitoring and Detection: Anomaly Detection vs. Manual Rules
The platform should profile data as it moves through your systems, evaluate it against rules and statistical baselines, and detect changes in schema, volume, freshness, and distribution before they reach consumers.
Manual threshold rules have their place. If you know a column should never be null, write a check for it. But relying exclusively on manually defined rules means you can only catch failures you already anticipated which, as your data estate grows, becomes an increasingly incomplete approach.
Automated anomaly detection fills the gaps. A good platform learns the historical behavior of your data, adapts as baselines shift, and surfaces deviations you wouldn't have thought to look for. The algorithms learn continuously, but your team's post-incident review is what directs that learning toward the right places. Over time, this loop means your observability layer spends less time re-detecting the same recurring problems and more time surfacing genuinely new ones. Coverage deepens not through manual effort but through accumulated signal.
The key consideration when evaluating tools is precision: how often does the anomaly detection fire on something real versus something that turns out to be expected variation? High false positive rates erode trust in alerting systems fast, and teams start ignoring notifications, which defeats the purpose entirely.
Soda’s metrics monitoring is powered by proprietary algorithms that outperform widely used open-source forecasting baselines. It adapts as your data changes, delivers 70% fewer false positives, and scales to 1B rows in just 64 seconds.
Alerting and Triage: The Right Alert, to the Right Person, With Context
Data incidents don't get resolved by tools, they get resolved by people. A platform should make it easy for the right person to know about an issue, claim ownership of it, and communicate progress without creating extra coordination overhead.
Useful things to look for include dataset ownership assignment, incident status tracking, and alert routing to the specific team or individual responsible for a given table rather than a general data engineering channel.
The best data observability platforms treat collaboration as a first-class feature, because the gap between detecting an issue and resolving it is almost always a people and process problem, not a technical one.
Soda's smart alerting let you configure exactly this kind of routing, connecting alerts to the tools your team already uses, with filters by severity, dataset, or check type.
Lineage and Root Cause Analysis: From Alert to Answer
Automated diagnostics should integrate logs, metrics, traces, and lineage to pinpoint the underlying cause of an anomaly — whether that's a quality degradation, a pipeline failure, a schema drift, or an upstream API change.
An alert that tells you something is wrong is useful. An alert that shows you where it started and what it affected is far more useful.
When evaluating data observability tools, look closely at the lineage and root cause analysis experience. Can you trace a failed check back to the upstream table or pipeline job that caused it? Can you see which downstream reports, models, or consumers are affected? How quickly can you move from a high-level anomaly to the actual records that failed?
The faster that journey is, the faster your team resolves the incident and the less downstream damage accumulates while the investigation is ongoing.
Check out the use case on how to Operationalize Data Governance with Collibra and Soda.
Cost Model and Scalability: What Happens When You Grow?
A platform that works well for 50 tables needs to perform just as effectively and without a significant pricing jump when monitoring 5,000. Evaluate how costs scale with the number of datasets, users, and scan frequency, and understand which capabilities are restricted to enterprise tiers before committing.
A few questions worth asking during any evaluation: Is there a free or open-source tier for getting started? Are compute costs handled in your warehouse or the vendor's infrastructure? Does the pricing model reward broad adoption across your team or make it expensive to scale? Those answers reveal whether a platform is genuinely built for growth.
Discover how the software provider Appfire reduced scan times from hours to seconds and gained real-time observability across its entire product portfolio with Soda.
Examples (Mini Playbooks)
Frameworks are useful. Seeing them applied to real situations is more useful. Here are three common incidents, the kind that show up in every data team’s post-mortem backlog, and how a data observability practice changes how quickly they get caught and resolved.
“Revenue dashboard is down”: how observability pinpoints upstream change
Your CFO opens the weekly revenue dashboard on Monday morning. The numbers look identical to last week. Not similar but identical. Something stopped updating.
Without observability, an analyst notices the stale figures, files a ticket, and the data engineering team begins manually tracing through the pipeline: checking job logs, inspecting tables, trying to identify where the data flow broke down. Depending on the complexity of the pipeline, this investigation can take hours.
With observability, a freshness monitor fires on Friday evening as soon as the expected update window passes without new data arriving:
The alert routes directly to the pipeline owner with the table name, the timestamp of the last successful load, and a link to the upstream dependency graph.
The engineer checks the lineage view, identifies that a source table two steps upstream stopped receiving its expected loads — pointing the team at the API connector that feeds it.
A review of the scan history also reveals the that table had been receiving partial loads for three days — context that would be invisible without a diagnostic record.
The issue is triaged before the weekend ends, well before the CFO opens the dashboard.
“Spike in orders”: volume anomaly + distribution drift
Row counts in the orders table spike by 340% overnight. At first glance, the business team is thrilled. Then someone notices the order values look wrong — thousands of records with a payment_amount of zero.
Without observability, the anomaly gets caught when a finance analyst notices the revenue figures don't reconcile with payment processor data. By then, the affected records have already propagated into three downstream aggregation tables and a daily finance report.
With observability two monitors fire within the same scan window:
A volume anomaly alert on the orders table flagging the unusual row count increase, and a distribution monitor on
payment_amountdetecting a significant spike in zero values well outside the historical normal range.Record-level anomaly detection runs a root cause analysis automatically, surfacing that the affected rows all share the same
source_channelvalue and pointing immediately to a misconfigured integration from a new sales channel that went live the previous evening.The affected records are flagged for review before they reach the finance report. The integration team is notified within the hour.
“New column broke dbt model”: schema change + lineage impact
An upstream engineering team adds a new column to a source table and renames an existing one as part of a routine schema update. They don't flag it as a breaking change. Three dbt models that referenced the original column name now fail silently, producing null outputs rather than throwing an error.
Without observability, the null outputs flow into two BI dashboards and a customer segmentation model. Nobody notices for four days, until a campaign team flags that their targeting looked wrong in the last batch run.
With observability:
A schema monitor fires the moment the rename is detected, surfacing a side-by-side comparison of the previous and current schema with the renamed column flagged clearly.
The lineage graph shows every downstream asset that referenced the original column: the three dbt models, the two dashboards, and the segmentation model.
Owners of each are notified automatically.
The dbt models get updated the same day the schema change lands before a single downstream consumer sees incorrect data.
Where to Go From Here
Most teams overthink the start. With observability, you don't pick datasets and instrument them one by one — connect your data sources and you get baseline monitoring across every table underneath in minutes.
The work that matters is layering attention on top of that coverage: identify your Tier 1 datasets, define SLOs for them, route their alerts to the right owners, and run a weekly review of what fired and what was real.
From there, signals that keep firing become tests, recurring incidents become data contracts, and coverage grows based on evidence rather than guesswork about what matters. That progression from reactive to systematic is what a mature data observability practice looks like, and it’s more accessible than most teams expect.
Ready to see it across your own data? Book a demo or start a free account and have monitoring running in minutes.
Frequently Asked Questions
Every data team runs into it eventually. A number does not match expectations, a metric cannot be traced with confidence, or a model's performance begins to drift without a clear explanation.
Data issues are a natural part of working with complex and constantly evolving systems, where changes in source data, transformations, or dependencies introduce unexpected problems. The real challenge is not that data breaks. It is that teams often lack timely visibility into when it breaks and why.
Without that visibility, issues move downstream into dashboards, models, and business processes before anyone has the context to respond effectively. Data observability provides continuous, automated insight into the health of your data systems at scale, so teams can detect, diagnose, and resolve issues before they impact decisions.
Data observability is usually commonly by five pillars:
Together, they tell you whether your data is arriving on time, looking the way it should, and behaving as expected.
In this guide, you'll find a breakdown of each pillar, a clear look at data observability tools worth knowing, and an implementation roadmap you can bring to your team.
Key Takeaways |
|---|
|
What is Data Observability?
Data observability is the practice of continuously monitoring data systems so problems are caught and explained before they impact downstream consumers. It applies the metrics-logs-traces principle of software observability to pipelines and datasets, surfacing freshness, volume, distribution, schema, and lineage signals that infrastructure monitoring alone cannot see. The result is faster detection, faster root cause, and fewer surprises in dashboards and models.
Software engineers solved a version of this problem years ago. When a service goes down, they don't manually inspect servers hoping to find the cause. They have metrics, logs, and traces that tell them exactly what's wrong and where. That practice is called observability, and it's been standard in software development for decades.
Data teams are applying the same thinking to their data pipelines and datasets: monitor continuously, detect problems the moment they develop, and surface enough context for your team to act fast, before downstream consumers ever feel the impact.
The reason this matters comes down to how complex data systems have become. A single pipeline can touch dozens of tables across multiple systems before a report ever gets generated, and any one of those layers can fail without warning.
Data incidents are routine in any complex pipeline, and each one takes meaningful engineering time to resolve. As data architectures sprawl across cloud warehouses, streaming pipelines, real-time transformations, and now GenAI and agentic AI systems, maintaining a holistic view of data health has become one of the most pervasive challenges data teams face.
That's not a staffing problem. It's a visibility problem, and a solid data observability practice is built to address exactly that.
The Five Pillars (with examples + metrics)
The five pillars cover the most important dimensions of data health: freshness tells you whether data arrived on time, volume tracks whether the right amount arrived, distribution flags shifts in the data's statistical shape, schema catches structural changes, and lineage maps the blast radius.
Together they convert "is something wrong with the data?" into a specific, actionable signal — and they're the foundation every observability tool, including Soda, builds on.
1. Freshness
Freshness measures whether data arrived when it was supposed to. Every dataset has an implied or explicit update schedule (hourly, daily, or after a pipeline run), and freshness tracking tells you whether that schedule is being met.
Where it breaks down: A pipeline runs but takes longer than expected, or it fails without raising an error and stops updating a table entirely. Downstream dashboards continue loading, but they're showing data from yesterday or last week. Nobody notices until a business decision has already been made on stale numbers.
Metrics to watch:
Time since last record insert
Gap between expected and actual update time
SLA breach rate over rolling windows (7-day, 30-day)
Alert tip: Set freshness thresholds relative to your pipeline's expected cadence, not a fixed window. A table that updates every 6 hours should alert at 7 hours, not 24. The tighter the SLA, the tighter the threshold.
How this looks in practice: Effective freshness monitoring reads warehouse metadata (most-recent-insert timestamps, partition load times, or commit logs) rather than scanning rows. That keeps coverage cheap enough to apply across thousands of tables. Once a baseline forms from historical update times, the platform surfaces any update that lands outside the expected window and routes the alert to the team that owns the pipeline.
2. Volume
Volume monitoring tracks how many rows are arriving in a dataset over time. It establishes a baseline (how much data normally flows through) and flags meaningful deviations in either direction.
Where it breaks down: A daily partition loads with 40% fewer rows than usual. Or a deduplication job runs incorrectly and row counts double overnight. Both are real incidents, and neither will surface in a system that only monitors infrastructure health.
Metrics to watch
Row count per table, per partition, per time window
Percentage change versus rolling average
Missing partition detection
Alert tip: Use relative thresholds rather than absolute ones. A table that normally receives 2 million rows should alert on a 15-20% deviation because baseline volumes shift naturally as your business grows.
How this looks in practice: Volume monitoring works by reading row count metadata and partition manifests from the warehouse rather than running full table scans. The platform tracks a rolling historical baseline for each table and flags deviations that fall outside the expected range without requiring anyone to predefine what "normal" looks like. As business volumes grow, the baseline adapts automatically, so alerts stay meaningful rather than becoming chronic noise.
3. Distribution
Distribution monitoring looks at the statistical shape of your data: the spread of data values, null rates, averages, and percentiles and flags when that shape changes in ways that suggest something has gone wrong upstream.
Where it breaks down: A payment_amount column starts showing an unusual spike in null values. An age field starts skewing toward implausible values after an upstream schema migration. A recommendation model starts producing worse outputs because the feature distributions it was trained on have quietly shifted. Distribution failures are some of the hardest to detect without automated monitoring.
Metrics to watch
Null rate and uniqueness rate per column
Mean, median, standard deviation
Percentile distributions (p50, p90, p99)
Value frequency changes for categorical columns
Alert tip: Static thresholds work poorly here. Distribution drift is subtle and gradual — the kind of thing that looks fine at any single point in time but is clearly wrong over a 30-day view. Anomaly detection for data, which learns your data's historical patterns and adapts as baselines shift, is significantly more reliable than hand-tuned rules for this pillar.
How this looks in practice: Distribution monitoring depends on profiling — a scheduled lightweight scan that captures column-level statistics like null rate, mean, median, percentiles, and frequent values, then tracks how each evolves. Single-metric anomaly detection catches obvious shifts; multivariate detection catches correlated drift across multiple columns at once, which is the failure mode that breaks ML pipelines silently. For columns with naturally skewed distributions, look for tools that adapt the baseline to the column's actual shape rather than applying static bounds.
4. Schema
Schema monitoring tracks the structure of your datasets, including column names, data types, and required fields and alerts when that structure changes unexpectedly.
Where it breaks down: An upstream team renames a column. A new data type gets introduced. A required field gets dropped from an API response. None of these generates errors at the infrastructure level, but each one can break every downstream process that depended on that column existing, being named correctly, or containing a specific type.
Metrics to watch
Column additions and removals
Data type changes
Nullable vs. non-nullable field changes
Column rename detection
Alert tip: The goal isn't to block all schema changes because some are intentional improvements. It's to make sure the right people know when a change happens before it propagates downstream. Route schema alerts to both the engineering team and the downstream consumers of that table.
How this looks in practice: Schema observability runs against catalog metadata (column names, types, nullability), diffing successive snapshots rather than scanning rows. That keeps coverage cheap enough to apply across thousands of tables. Not every change carries the same risk: an added column is informational, a widened type usually flows through cleanly, but a renamed column is the dangerous case. Downstream queries keep running and quietly return nulls until someone notices a week later that a dashboard looks off. What makes schema observability useful is how short it can make that detection window.
5. Lineage
Data lineage maps the full journey of your data from source systems through transformations, joins, and aggregations, all the way to the dashboards and models that consume it. When something breaks, lineage tells you where it started and everything it affected.
Where it breaks down: A schema change in a source table causes a downstream aggregation to fail silently. Three reports and one ML model are now producing wrong outputs. Without lineage, finding all of them requires manually tracing every dependency. A single upstream schema change can create a freshness problem one table downstream, a distribution problem two tables downstream, and a broken report the marketing team is using to make decisions.
Metrics to watch
Upstream dependency count per dataset
Downstream consumer count (your blast radius)
Time-to-detect propagation of an upstream issue
Alert tip: Use lineage to scope your incident response, not just to debug after the fact. When a freshness or volume alert fires, your first question should be: what depends on this table? A lineage graph answers that immediately and helps you prioritize which downstream teams to notify first.
How this looks in practice: Data lineage is captured from query logs, transformation code, and BI tool dependencies, then stitched into a dependency graph that maps each dataset to its upstream sources and downstream consumers. Most teams source this from a dedicated lineage tool or their orchestrator rather than building it by hand.
What makes lineage useful in an observability context is how it connects to the other four pillars: a freshness alert upstream becomes a list of affected dashboards, a schema change becomes a list of consumers to notify, a distribution drift becomes a question of which model to retrain first. Lineage makes those connections visible.
Data Observability vs Data Testing (And Why You Need Both)
There can be some confusion around these two approaches, so it's worth pausing to separate them properly because confusing them leads to real gaps in how teams protect their data.
Data testing asks: Does this data meet the rules we've defined? Is the customer_id field unique? Are there nulls in a column that should never be empty? Are these revenue figures within an expected range? Answering those questions requires explicit, predefined checks that encode a known expectation and fail when reality doesn't match.
Data observability works differently. Rather than validating data against predefined rules, it watches how your data behaves over time and flags when something looks off, even if you never thought to write a rule for it. A table that normally receives 2 million rows arrives with 800,000. A column's average shifts by 30% overnight. A pipeline that usually completes in 20 minutes is now running for 3 hours. To be detected, these issues require context, history, and continuous data quality monitoring.
A useful way to hold the distinction: Data testing catches known knowns. Data observability catches unknown unknowns.
Data Observability | Data Testing | |
|---|---|---|
Approach | Reactive and adaptive | Proactive and preventative |
When it runs | In production, runtime monitoring | Pre-production, during development or CI/CD |
What it does | Monitors data behavior and changes over time; detects anomalies, schema changes, and unexpected issues | Validates known rules and enforces contracts |
What it catches | Unknown unknowns — deviations no one thought to write a rule for | Known knowns — failures you've defined a rule for |
Configuration | Adaptive — baselines learned from historical data | Explicit, per-check (you write the rule) |
Output when it fires | Signal (something looks unusual; investigate) | Certainty (rule failed) |
Example | Row count dropped 40% overnight without anyone configuring a 40% threshold |
|
Neither is sufficient on its own. Observability gives you a broad, immediate signal across your entire data estate with almost no configuration. It's the fastest way to get coverage and start learning where your data is fragile. Testing gives you precision. When a check fails, you know with certainty that something is wrong, not just that something looks unusual.
The practical implication: start with observability to get coverage fast. Then use those signals to invest in tests and data contracts for the datasets that matter most.
Observability surfaces where tests are needed; tests reduce the noise that observability has to look through.
Framing observability vs. testing as a competition misses the point. The teams that get the most out of their data use both deliberately, at different stages, for different purposes.
Ready to see what observability looks like in practice? Book a demo to see Soda Cloud in action.
How Do You Implement Data Observability? (Step-by-Step)
Knowing where to start on a real data stack, with real constraints, limited engineering time, and dozens of equally important tables, is half the challenge. This roadmap is designed to be sequential. Each step builds on the last, and you don't need to complete all seven before you start seeing value. Most teams have meaningful coverage by step four.
Identify what matters, define what "healthy" looks like, instrument the signals, let baselines form, route alerts thoughtfully, build a triage workflow, and close the loop with prevention.
Step 1: Identify Your Tier 1 Assets
Before instrumenting anything, get clear on what actually matters. Tier 1 data assets are the datasets and pipelines your business depends on most directly: executive dashboards, revenue reporting tables, customer-facing data products, and any datasets feeding machine learning models in production.
Useful test: if this table was wrong for 24 hours, who would notice and what would break? If the answer involves a board meeting, a customer SLA, or a production ML model, it's Tier 1.
Start there and work outward. Most teams find they have somewhere between 10 and 30 genuinely critical datasets, which is a manageable scope for getting first coverage in place quickly.
Step 2: Define Your SLAs and SLOs
Once you know what to protect, define what "healthy" actually means for each asset. Set explicit Service Level Agreements (SLAs) and Service Level Objectives (SLOs) for the metrics that matter most.
For freshness: when does this table need to be updated, and how often?
For completeness: what's the maximum acceptable null rate for critical columns?
For volume: what deviation from baseline warrants an alert?
Writing these down forces a useful conversation between data engineers and the business stakeholders who consume the data. The outcome is a shared definition of done — not just for building pipelines, but for maintaining them.
In regulated industries, compliance frameworks may drive many of these standards. Read more about Closing the BCBS 239 data quality gap with Soda.
Step 3: Instrument Your Signals
With your Tier 1 assets identified and SLOs defined, connect your data sources and let observability begin collecting metadata signals: row counts, schema snapshots, freshness timestamps, null rates, and distribution statistics.
One of the practical advantages of a modern data observability platform is that this step requires almost no manual configuration per table. Monitoring applies at the data source level and extends automatically to every dataset underneath, meaning you can get coverage across hundreds of tables in minutes, not weeks. If you have pipeline logs and job metadata available, bring those in too. The more signals you have early, the faster baselines form.
Step 4: Establish Behavioral Baselines
Anomaly detection only works if the system understands what "normal" looks like. During this phase, your observability layer learns the historical patterns of your data, including typical row count ranges, expected freshness windows, and normal distribution shapes, and uses that context to distinguish genuine issues from expected variation.
With built-in backfilling, you don't have to wait weeks for baselines to form. Historical metadata is analyzed from the moment observability is enabled, so the algorithm can start detecting meaningful deviations right away rather than producing noisy alerts during a warmup period.
Plan to spend a few weeks reviewing early alerts, flagging false positives, and refining thresholds. Tighten the freshness window on a table that was slow to alert, add distribution monitoring to a column that turned out to be fragile, adjust the volume deviation threshold for a partition that sees predictable seasonal swings.
2K Games migrated from rule-based checks and saw alert volume drop materially as Soda's anomaly detection adapted to their per-dataset baselines. Read the full case study.
Step 5: Build an Alerting Strategy That People Will Actually Follow
An alerting setup that pages everyone for everything quickly trains people to ignore it. The goal is the right alert, reaching the right person, through the right channel, with enough context to act.
A tiered approach works well: critical freshness or volume failures on Tier 1 assets go directly to PagerDuty or as a high-priority Slack message to the on-call engineer. Distribution drift or schema warnings on secondary tables go to Jira as tracked issues. Lower-priority signals get batched into a daily digest for the data team to review together.
Step 6: Create a Triage Workflow
When an alert fires, ambiguity about who owns it or what to do first costs time you don't have. A lightweight triage workflow solves this before incidents happen, instead of during them.
At minimum, every Tier 1 dataset should have a designated owner, a clear escalation path, and a short runbook, which is a documented set of first-response steps specific to that dataset. What are the most likely causes of a freshness failure here? Which upstream tables should you check first? Who needs to be notified if it's not resolved within an hour?
Lineage context is particularly valuable at this stage. When an alert fires on a downstream table, being able to immediately see what feeds it and trace the issue back to its source cuts resolution time significantly.
Step 7: Close the Loop With Prevention
Observability tells you when something went wrong. The prevention loop is about making sure the same thing doesn't go wrong again.
Each incident leaves behind useful information: which signal fired, how far the issue propagated, and how long it took to detect. The next move is to shift it left: encode it as an explicit check and run it earlier in the pipeline, so known failures don’t reach production again.
Data contracts formalize this approach, creating a structured agreement between data producers and consumers that defines what a dataset should look like and enforces those standards every time new data arrives.
Where observability is automatic and metadata-driven, contracts are explicit and rule-driven.
Example using Soda Contract Language:
dataset: warehouse/prod/public/orders

checks:
  - schema:
      allow_extra_columns: false
  - freshness:
      column: order_datetime
      threshold:
        unit: hour
        must_be_less_than: 6
  - row_count:
      threshold:
        must_be_greater_than: 0
Discover how the AI automation platform Make embedded Soda data contracts at ingestion and transformation to catch issues before they reach dashboards.
The roadmap doesn't end here; it cycles. New datasets get onboarded, new SLOs get defined, and new incidents lead to new tests. That's not a sign the system is failing. It's a sign it's working.
What to Look for in Data Observability Tools and Platforms
Gartner's Market Guide for Data Observability Tools names four key features every platform should deliver: monitoring and detection, alerting and triage, data lineage and impact analysis, and root cause analysis — plus extensibility across your stack as a mandatory enabler.
However, choosing a platform built for end-to-end data observability is less about features on a checklist and more about whether the tool fits how your team actually works: your stack, your scale, and the way incidents get handled. Here's what to evaluate before deciding.
Stack Coverage: Does It Connect to Your Entire Ecosystem?
A data issue rarely starts and ends in one place. It might originate in an upstream API, travel through a dbt transformation, land in Snowflake, and break a Tableau dashboard that three teams depend on.
A data observability tool that only connects to your warehouse gives you a partial picture at best. The goal is a platform that slots into your existing workflow rather than creating a parallel one.
Soda offers native integrations across every layer: data sources and warehouses (Snowflake, Databricks, BigQuery, Redshift, Postgres), orchestrators (dbt, Dagster, Prefect, Airflow), BI tools (Looker, Tableau, Power BI), and your team's existing alerting and ticketing setup (Slack, Jira, PagerDuty, ServiceNow).
Monitoring and Detection: Anomaly Detection vs. Manual Rules
The platform should profile data as it moves through your systems, evaluate it against rules and statistical baselines, and detect changes in schema, volume, freshness, and distribution before they reach consumers.
Manual threshold rules have their place. If you know a column should never be null, write a check for it. But relying exclusively on manually defined rules means you can only catch failures you already anticipated which, as your data estate grows, becomes an increasingly incomplete approach.
Automated anomaly detection fills the gaps. A good platform learns the historical behavior of your data, adapts as baselines shift, and surfaces deviations you wouldn't have thought to look for. The algorithms learn continuously, but your team's post-incident review is what directs that learning toward the right places. Over time, this loop means your observability layer spends less time re-detecting the same recurring problems and more time surfacing genuinely new ones. Coverage deepens not through manual effort but through accumulated signal.
The key consideration when evaluating tools is precision: how often does the anomaly detection fire on something real versus something that turns out to be expected variation? High false positive rates erode trust in alerting systems fast, and teams start ignoring notifications, which defeats the purpose entirely.
Soda’s metrics monitoring is powered by proprietary algorithms that outperform widely used open-source forecasting baselines. It adapts as your data changes, delivers 70% fewer false positives, and scales to 1B rows in just 64 seconds.
Alerting and Triage: The Right Alert, to the Right Person, With Context
Data incidents don't get resolved by tools, they get resolved by people. A platform should make it easy for the right person to know about an issue, claim ownership of it, and communicate progress without creating extra coordination overhead.
Useful things to look for include dataset ownership assignment, incident status tracking, and alert routing to the specific team or individual responsible for a given table rather than a general data engineering channel.
The best data observability platforms treat collaboration as a first-class feature, because the gap between detecting an issue and resolving it is almost always a people and process problem, not a technical one.
Soda's smart alerting let you configure exactly this kind of routing, connecting alerts to the tools your team already uses, with filters by severity, dataset, or check type.
Lineage and Root Cause Analysis: From Alert to Answer
Automated diagnostics should integrate logs, metrics, traces, and lineage to pinpoint the underlying cause of an anomaly — whether that's a quality degradation, a pipeline failure, a schema drift, or an upstream API change.
An alert that tells you something is wrong is useful. An alert that shows you where it started and what it affected is far more useful.
When evaluating data observability tools, look closely at the lineage and root cause analysis experience. Can you trace a failed check back to the upstream table or pipeline job that caused it? Can you see which downstream reports, models, or consumers are affected? How quickly can you move from a high-level anomaly to the actual records that failed?
The faster that journey is, the faster your team resolves the incident and the less downstream damage accumulates while the investigation is ongoing.
Check out the use case on how to Operationalize Data Governance with Collibra and Soda.
Cost Model and Scalability: What Happens When You Grow?
A platform that works well for 50 tables needs to perform just as effectively and without a significant pricing jump when monitoring 5,000. Evaluate how costs scale with the number of datasets, users, and scan frequency, and understand which capabilities are restricted to enterprise tiers before committing.
A few questions worth asking during any evaluation: Is there a free or open-source tier for getting started? Are compute costs handled in your warehouse or the vendor's infrastructure? Does the pricing model reward broad adoption across your team or make it expensive to scale? Those answers reveal whether a platform is genuinely built for growth.
Discover how the software provider Appfire reduced scan times from hours to seconds and gained real-time observability across its entire product portfolio with Soda.
Examples (Mini Playbooks)
Frameworks are useful. Seeing them applied to real situations is more useful. Here are three common incidents, the kind that show up in every data team’s post-mortem backlog, and how a data observability practice changes how quickly they get caught and resolved.
“Revenue dashboard is down”: how observability pinpoints upstream change
Your CFO opens the weekly revenue dashboard on Monday morning. The numbers look identical to last week. Not similar but identical. Something stopped updating.
Without observability, an analyst notices the stale figures, files a ticket, and the data engineering team begins manually tracing through the pipeline: checking job logs, inspecting tables, trying to identify where the data flow broke down. Depending on the complexity of the pipeline, this investigation can take hours.
With observability, a freshness monitor fires on Friday evening as soon as the expected update window passes without new data arriving:
The alert routes directly to the pipeline owner with the table name, the timestamp of the last successful load, and a link to the upstream dependency graph.
The engineer checks the lineage view, identifies that a source table two steps upstream stopped receiving its expected loads — pointing the team at the API connector that feeds it.
A review of the scan history also reveals the that table had been receiving partial loads for three days — context that would be invisible without a diagnostic record.
The issue is triaged before the weekend ends, well before the CFO opens the dashboard.
“Spike in orders”: volume anomaly + distribution drift
Row counts in the orders table spike by 340% overnight. At first glance, the business team is thrilled. Then someone notices the order values look wrong — thousands of records with a payment_amount of zero.
Without observability, the anomaly gets caught when a finance analyst notices the revenue figures don't reconcile with payment processor data. By then, the affected records have already propagated into three downstream aggregation tables and a daily finance report.
With observability two monitors fire within the same scan window:
A volume anomaly alert on the orders table flagging the unusual row count increase, and a distribution monitor on
payment_amountdetecting a significant spike in zero values well outside the historical normal range.Record-level anomaly detection runs a root cause analysis automatically, surfacing that the affected rows all share the same
source_channelvalue and pointing immediately to a misconfigured integration from a new sales channel that went live the previous evening.The affected records are flagged for review before they reach the finance report. The integration team is notified within the hour.
“New column broke dbt model”: schema change + lineage impact
An upstream engineering team adds a new column to a source table and renames an existing one as part of a routine schema update. They don't flag it as a breaking change. Three dbt models that referenced the original column name now fail silently, producing null outputs rather than throwing an error.
Without observability, the null outputs flow into two BI dashboards and a customer segmentation model. Nobody notices for four days, until a campaign team flags that their targeting looked wrong in the last batch run.
With observability:
A schema monitor fires the moment the rename is detected, surfacing a side-by-side comparison of the previous and current schema with the renamed column flagged clearly.
The lineage graph shows every downstream asset that referenced the original column: the three dbt models, the two dashboards, and the segmentation model.
Owners of each are notified automatically.
The dbt models get updated the same day the schema change lands before a single downstream consumer sees incorrect data.
Where to Go From Here
Most teams overthink the start. With observability, you don't pick datasets and instrument them one by one — connect your data sources and you get baseline monitoring across every table underneath in minutes.
The work that matters is layering attention on top of that coverage: identify your Tier 1 datasets, define SLOs for them, route their alerts to the right owners, and run a weekly review of what fired and what was real.
From there, signals that keep firing become tests, recurring incidents become data contracts, and coverage grows based on evidence rather than guesswork about what matters. That progression from reactive to systematic is what a mature data observability practice looks like, and it’s more accessible than most teams expect.
Ready to see it across your own data? Book a demo or start a free account and have monitoring running in minutes.
Frequently Asked Questions
What's the difference between data observability and data quality?
Data quality is about the state of the data itself: how fit your data is for use, measured along dimensions like accuracy, completeness, timeliness, and validity. Data observability is about visibility into how data and pipelines behave in production and the ability to monitor the health of your data systems through metadata (typically across freshness, volume, schema, distribution, and lineage).
Is data observability just monitoring?
Not quite. Traditional monitoring watches infrastructure: did the pipeline run, did the job complete, is the warehouse available? Data observability watches the shape and behavior of the data itself: is what arrived correct, complete, and behaving as it should? A pipeline can run successfully and still deliver stale, incomplete, or broken data. These issues often go unnoticed with infrastructure monitoring but are identified through data observability.
How is it different from data testing?
Data testing validates data against rules you’ve already defined, while data observability detects issues you didn’t know to look for. Testing asks, “Does this meet our expectations?” and observability asks, “Is anything behaving unusually?” Both are valuable and work best together: observability provides broad coverage quickly, and testing gives precision and enforcement on the datasets that matter most.
Can small teams do this without an observability platform?
Yes, to a point. A small team with a handful of critical tables can achieve reasonable coverage with from scheduled scripts — a row-count tracker here, a freshness timestamp check there, a schema diff in a nightly job. The ceiling appears quickly, though: as the number of tables grows, maintaining hand-written monitors becomes a significant time investment, and the lack of historical baselines makes anomaly detection nearly impossible without automation. Most small teams find that starting with Soda Core (OSS) or a platform's free tier takes them further, faster, than building the same capability from scratch.
Trusted by the world’s leading enterprises
Real stories from companies using Soda to keep their data reliable, accurate, and ready for action.
At the end of the day, we don’t want to be in there managing the checks, updating the checks, adding the checks. We just want to go and observe what’s happening, and that’s what Soda is enabling right now.

Sid Srivastava
Director of Data Governance, Quality and MLOps
Investing in data quality is key for cross-functional teams to make accurate, complete decisions with fewer risks and greater returns, using initiatives such as product thinking, data governance, and self-service platforms.

Mario Konschake
Director of Product-Data Platform
Soda has integrated seamlessly into our technology stack and given us the confidence to find, analyze, implement, and resolve data issues through a simple self-serve capability.

Sutaraj Dutta
Data Engineering Manager
Our goal was to deliver high-quality datasets in near real-time, ensuring dashboards reflect live data as it flows in. But beyond solving technical challenges, we wanted to spark a cultural shift - empowering the entire organization to make decisions grounded in accurate, timely data.

Gu Xie
Head of Data Engineering
4.4 of 5
Your data has problems.
Now they fix themselves.
Automated data quality, remediation, and management.
One platform, agents that do the work, you approve.
Trusted by


Trusted by the world’s leading enterprises
Real stories from companies using Soda to keep their data reliable, accurate, and ready for action.
At the end of the day, we don’t want to be in there managing the checks, updating the checks, adding the checks. We just want to go and observe what’s happening, and that’s what Soda is enabling right now.
Sid Srivastava
Director of Data Governance, Quality and MLOps
Investing in data quality is key for cross-functional teams to make accurate, complete decisions with fewer risks and greater returns, using initiatives such as product thinking, data governance, and self-service platforms.
Mario Konschake
Director of Product-Data Platform
Soda has integrated seamlessly into our technology stack and given us the confidence to find, analyze, implement, and resolve data issues through a simple self-serve capability.
Sutaraj Dutta
Data Engineering Manager
Our goal was to deliver high-quality datasets in near real-time, ensuring dashboards reflect live data as it flows in. But beyond solving technical challenges, we wanted to spark a cultural shift - empowering the entire organization to make decisions grounded in accurate, timely data.
Gu Xie
Head of Data Engineering
4.4 of 5
Your data has problems.
Now they fix themselves.
Automated data quality, remediation, and management.
One platform, agents that do the work, you approve.
Trusted by
Solutions