12 Data Quality Metrics That Actually Matter (With Examples)
12 Data Quality Metrics That Actually Matter (With Examples)
12 Data Quality Metrics That Actually Matter (With Examples)

Fabiana Ferraz
Fabiana Ferraz
Rédacteur technique chez Soda
Rédacteur technique chez Soda
Table des matières
Your completeness check passed. Your null rate looks clean. Your row count is within range. And somewhere downstream, a dbt model just silently returned wrong numbers because a column your pipeline depends on started arriving empty two hours ago.
This is what happens when you track the wrong metrics. Many teams instrument what's easy to query, not what reflects actual pipeline health. And the gap between the two only shows up when a consumer notices something broken.
A quick distinction worth making before diving in:
Data quality dimensions are qualitative properties your data should have: accuracy, completeness, timeliness, etc
Data quality metrics quantify those properties into measurable, alertable numbers
Data quality KPIs tie metrics to business targets, the thresholds that actually matter to stakeholders
The 12 data quality metrics below are designed to get you to KPIs, with practical examples and Soda contract language you can apply directly in your pipelines. Each code block is a YAML check: define it against a named dataset, run soda scan, and Soda alerts your team or blocks the pipeline on failure, depending on how you've configured enforcement.
6 Core Data Quality Metrics
Incomplete, invalid, or duplicate data causes pipeline failures across production environments. Nearly 97% of senior data leaders report that data integration failures have slowed their analytics or AI programs (Fivetran, 2026). Yet most teams discover issues from consumer complaints rather than automated checks.
The six metrics below are the ones that belong in every data quality program, regardless of stack or scale. They are specific enough to alert on, trend over time, and report against SLAs.
1. Completeness Rate
Definition: The percentage of required fields that contain non-null, non-empty values.
Formula: (Non-null values / Total values) × 100
Worked example: Your dim_customer table has 50,000 rows. The last_name column contains 4,250 nulls. Completeness rate = ((50,000 − 4,250) / 50,000) × 100 = 91.5%. If your SLA requires 98%, this is a failing pipeline.
Suggested threshold: ≥ 98% for primary and foreign key columns; ≥ 95% for non-critical descriptive fields.
dataset: warehouse/prod/public/dim_customer
columns:
  - name: last_name
    checks:
      - missing:
          name: "Last name completeness must exceed 98%"
          threshold:
            metric: percent
            must_be_less_than: 2
          attributes:
            dimension
Running this check gates your pipeline before last_name nulls reach any dependent model that relies on it for customer segmentation or identity resolution.
2. Validity Rate
Definition: The percentage of values that conform to a defined set of allowed values, formats, or ranges.
Formula: (Valid values / Total values) × 100
Worked example: Your dim_product table has 12,000 rows. The size column should only contain S, M, or L. You find 360 rows with values like XL, small, or null. Validity rate = ((12,000 − 360) / 12,000) × 100 = 97%. Anything outside the allowed set will break filtering logic in your reporting layer.
Suggested threshold: ≥ 99% for columns used in joins or filters; ≥ 95% for freeform descriptive columns.
dataset: warehouse/prod/public/dim_product
columns:
  - name: size
    checks:
      - invalid:
          name: "Size must be S, M, or L only"
          valid_values: ['S', 'M', 'L']
          threshold:
            metric: percent
            must_be_less_than: 1
          attributes:
            dimension
Validity checks are where domain knowledge earns its place in contract language. The engineering team can write the check, but the allowed value set should be agreed on with data consumers before it ships.
3. Uniqueness Rate
Definition: The percentage of records that are free from duplication across a column or combination of columns that should be unique.
Formula: ((Total records − Duplicate records) / Total records) × 100
Worked example: Your dim_product table contains 12,000 rows. A duplicate check on the id column surfaces 240 repeated values. Uniqueness rate = ((12,000 − 240) / 12,000) × 100 = 98%. Those 240 duplicates will cause fan-out in any join that depends on this column, silently inflating metrics.
Suggested threshold: 100% for primary keys and surrogate keys; ≥ 99.5% for natural keys with known edge cases.
dataset: warehouse/prod/public/dim_product
columns:
  - name: id
    data_type: varchar
    checks:
      - duplicate:
          name: "Product ID must be unique"
          attributes:
            dimension
For composite keys (for example, customer_id and order_date), move the check to the dataset level and pass both columns explicitly.
4. Freshness
Definition: The time elapsed since the most recent record was written to a dataset, measured against a defined SLA.
Formula: Current timestamp − MAX(updated_at)
Worked example: Your pipeline is expected to land data every hour. At 14:00, you query MAX(updated_at) and get 11:45. Lag = 2 hours 15 minutes, breaching a 2-hour SLA. A dashboard refreshing at 14:00 is now serving 2+ hour-old data with no visible indication to the consumer.
Suggested threshold: Depends entirely on consumption context. Real-time dashboards typically need < 1 hour; batch analytical models can tolerate < 24 hours.
dataset: warehouse/prod/public/fact_orders
checks:
  - freshness:
      name: "Orders table must refresh within 24 hours"
      column: updated_at
      threshold:
        unit: hour
        must_be_less_than: 24
      attributes:
        dimension
Freshness is one of the highest-signal metrics for operational pipelines precisely because it fails visibly and fast. A stale table is often the first symptom of a broken upstream dependency.
5. Accuracy Rate
Definition: The percentage of records that match a verified, authoritative source of truth, one where correctness is externally established.
Formula: (Records matching source of truth / Total records) × 100
Worked example: You pull 10,000 customer records from your warehouse and reconcile them against your CRM export. 312 records have mismatched email values. Accuracy rate = ((10,000 − 312) / 10,000) × 100 = 96.88%. Those 312 records will generate failed lookups in any campaign tool consuming the warehouse.
Suggested threshold: ≥ 99% for PII and transactional fields; ≥ 97% for enrichment data with known lag.
dataset: warehouse/prod/public/dim_customer
checks:
  - metric:
      name: "CRM reconciliation: email mismatches must be below 1%"
      query: |
        SELECT COUNT(*) FROM dim_customer dc
        LEFT JOIN crm_export ce ON dc.customer_id = ce.customer_id
        WHERE dc.email != ce.email
        AND ce.customer_id IS NOT NULL
      threshold:
        must_be_less_than: 100
      attributes:
        dimension
Accuracy requires a reference point. Without a source of truth to reconcile against, what looks like an accuracy check is usually a validity check in disguise.
6. Consistency Rate
Definition: The percentage of records that match across two peer systems where neither is the source of truth, but both are expected to represent the same underlying reality.
Formula: (Matching records across systems / Total records) × 100
Worked example: Your warehouse holds product prices ingested from an internal pricing service. Your BI layer pulls prices from the same pricing service via API at query time. Comparing 8,000 records, you find 560 with price discrepancies greater than $0.05. Consistency rate = ((8,000 − 560) / 8,000) × 100 = 93%. Neither system is wrong by design, but they disagree, and that disagreement will surface as conflicting numbers in different reports.
Suggested threshold: ≥ 99% for financial and transactional fields; ≥ 97% for operational data with known sync delays.
dataset: warehouse/prod/public/dim_product
checks:
  - metric:
      name: "Price consistency: warehouse vs API must agree within $0.05"
      query: |
        SELECT COUNT(*) FROM dim_product dp
        JOIN api_pricing_snapshot aps
        ON dp.product_id = aps.product_id
        WHERE ABS(dp.price - aps.price) > 0.05
      threshold:
        must_be: 0
      attributes:
        dimension
The practical difference between accuracy and consistency matters when you're triaging an incident. Accuracy failures point you toward a data engineering problem: something went wrong in ingestion or transformation. Consistency failures point you toward a systems alignment problem: two sources that should agree have drifted, and you need to understand why before deciding which one to trust.
Try it on your own data. Soda Core is open source — run your first contract check against a production dataset in under 30 minutes. No vendor setup required.
6 Advanced Data Quality Metrics
The checks above catch known violations. They don't catch operational failures such as pipeline downtime, schema drift, or coverage gaps that leave entire datasets unmonitored. These six advanced data quality metrics measure the health of your quality program itself, not just the data it monitors.
7. Data Downtime
Definition: The total time during which a dataset was unavailable, incomplete, or known to be erroneous, measured from incident detection to resolution.
Formula: Data Downtime = Incident count × Average (TTD + TTR)
Three sub-metrics drive this number:
Incident count: How many data quality failures occurred in a given period
Time-to-detect (TTD): How long between a failure occurring and your team knowing about it
Time-to-resolve (TTR): How long from detection to the dataset being trustworthy again
Worked example: In a 30-day period, your team logs 4 incidents. Average TTD is 3 hours, average TTR is 5 hours. Total data downtime = 4 × (3 + 5) = 32 hours. For a pipeline feeding a real-time sales dashboard, 32 hours of monthly downtime is a significant reliability problem, even if no single incident lasted more than a day.
Suggested threshold: TTD < 1 hour for critical pipelines; TTR < 4 hours; total monthly downtime < 8 hours per critical dataset.
dataset: warehouse/prod/public/fact_orders
checks:
  - freshness:
      name: "Downtime signal: orders table stale beyond 1-hour SLA"
      column: updated_at
      threshold:
        unit: hour
        must_be_less_than: 1
      attributes:
        dimension: timeliness
  - row_count:
      name: "Downtime signal: orders table empty or truncated"
      threshold:
        must_be_greater_than: 0
      attributes:
        dimension
Each failed check opens an incident in Soda Cloud. TTD is the time between the failure timestamp and the alert notification. TTR is the time between incident creation and resolution. The downtime formula runs on top of those incident records, not inside the check itself.
Reducing TTD is usually higher leverage than reducing TTR. Faster detection shortens every incident automatically, regardless of how complex the fix turns out to be.
8. Schema Change Rate
Definition: The number of unplanned schema changes, including added, removed, or retyped columns, occurring in a dataset over a defined period.
Formula: Unplanned schema changes / Total observed schema snapshots
Worked example: Over 90 days, your fact_orders table undergoes 11 schema snapshots. Three surface unplanned changes: a column renamed from cust_id to customer_id, a VARCHAR field silently cast to TEXT, and a column dropped without notice. Schema change rate = 3/11 = 27%. Each of those changes had the potential to silently break a dependent dbt model.
Suggested threshold: 0 unplanned changes per period for production tables with downstream dependencies. Gate every schema change through a contract check before it reaches production.
dataset: warehouse/prod/public/fact_orders
checks:
  - schema:
      name: "No unplanned schema changes on fact_orders"
      allow_extra_columns: false
      allow_other_column_order: false
      attributes:
        dimension
Schema drift is one of the most common sources of silent pipeline failures. A column rename in a source system doesn't throw an error. It just starts returning nulls in consuming models, and your completeness check catches it hours later after the damage is done. Locking schema with a contract check means the failure surfaces at the gate, not in production.
9. Transformation Failure Rate
Definition: The percentage of pipeline job runs that fail during transformation, covering dbt model errors, Spark job failures, and any processing step between raw ingestion and the serving layer.
Formula: (Failed transformation jobs / Total transformation jobs) × 100
Worked example: Over 30 days, your orchestration layer logs 840 transformation job runs. 42 fail, mostly due to upstream schema changes and type casting errors. Transformation failure rate = (42 / 840) × 100 = 5%. On a pipeline running 28 times per day, that's roughly 1.4 failures per day, enough to make your data reliability story uncomfortable in a stakeholder review.
Suggested threshold: < 1% for critical production pipelines; < 3% for experimental or early-stage pipelines.
dataset: warehouse/prod/public/fact_orders
checks:
  - metric:
      name: "Transformation failure proxy: negative amounts must be zero"
      query: |
        SELECT COUNT(*) FROM fact_orders
        WHERE amount < 0
      threshold:
        must_be: 0
      attributes:
        dimension
You won't always catch transformation failures with a single check. Instrumenting known failure signatures, like negative amounts or impossible date ranges, gives you a proxy metric that trends alongside your job failure rate.
10. Table Health Score
Definition: A weighted composite score that aggregates multiple data quality metrics into a single number representing the overall trustworthiness of a dataset.
Formula: Health Score = (w₁ × Completeness) + (w₂ × Validity) + (w₃ × Freshness) + (w₄ × Accuracy)
Weights should reflect the consumption context. A financial reporting table weights accuracy heavily. A marketing segmentation table might weight freshness and completeness more.
Worked example: For dim_customer, you assign equal weights of 0.25 to each dimension. Scores from your last pipeline run: Completeness = 96%, Validity = 99%, Freshness = 100% (within SLA), Accuracy = 94%. Health score = (0.25 × 96) + (0.25 × 99) + (0.25 × 100) + (0.25 × 94) = 97.25 / 100.
Suggested threshold: ≥ 95 for datasets powering executive dashboards or financial reporting; ≥ 90 for operational datasets; flag anything below 85 for immediate review.
Soda calculates this from your check results automatically. The formula above shows the underlying logic, useful if you're building your own composite in custom reporting.
The health score is most useful as a communication tool: a single number stakeholders can anchor trust conversations around without interpreting five separate metric trends. In Soda Cloud, it's surfaced in the dataset dashboard and rolled up across all monitored datasets in the organization dashboard (see image bellow).
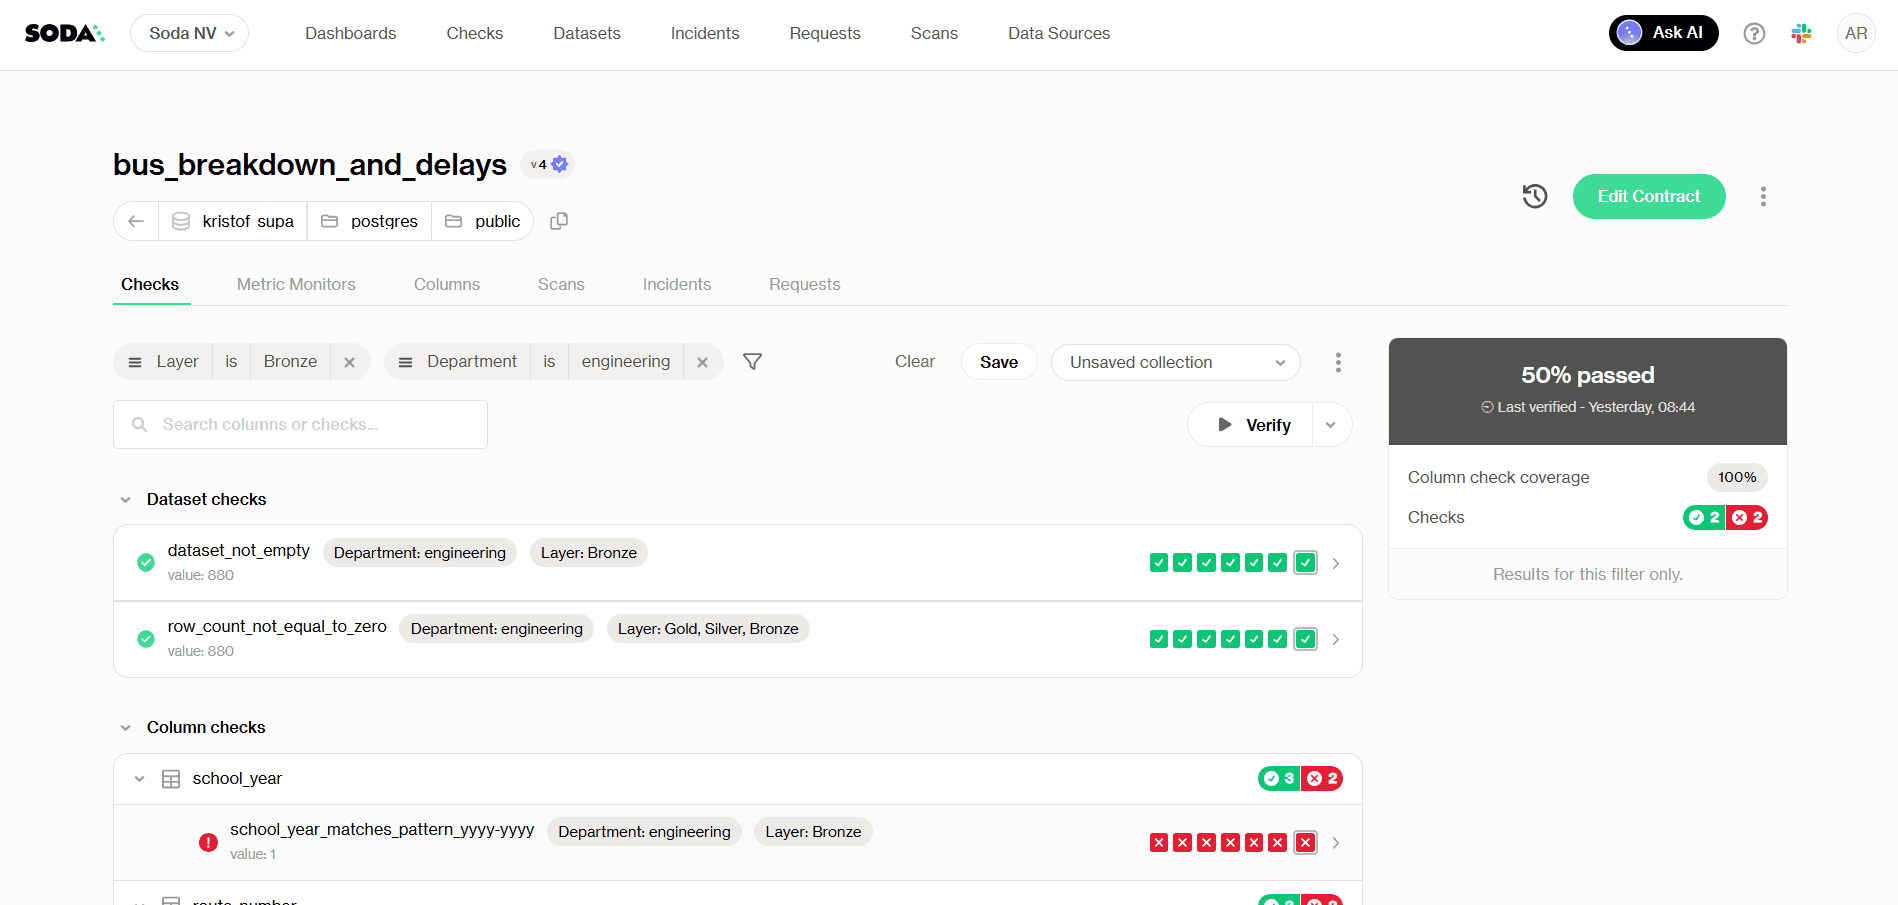
Checks tab with checks filters - Health score at 50%
5. Coverage Rate
Definition: The percentage of production datasets that have at least one automated data quality check running against them.
Formula: (Datasets with ≥1 active check / Total production datasets) × 100
Worked example: Your warehouse has 214 production tables. Your team has instrumented checks on 129 of them. Coverage rate = (129 / 214) × 100 = 60.3%. The remaining 40% are running without any quality gate, which means any upstream change, schema drift, or ingestion failure in those tables will only surface when a consumer notices something wrong.
Suggested threshold: 100% coverage on Tier 1 datasets feeding dashboards, ML models, or financial reporting; ≥ 80% across all production datasets.
Scaling coverage manually doesn't work past a certain point. Soda's Contract Autopilot automates contract lifecycle management, generating and maintaining checks across datasets so coverage grows with your infrastructure rather than lagging behind it.
6. Time-to-Value
Definition: The total lag between data landing in your ingestion layer and that data being available and trustworthy in your BI or serving layer.
Formula: Time-to-Value = BI availability timestamp − Ingestion timestamp
Worked example: Raw order events land in your data lake at 08:00. They pass through three transformation stages, a quality gate, and a materialization step before surfacing in your reporting layer at 11:45. Time-to-value = 3 hours 45 minutes. If your sales team expects morning numbers before their 09:30 standup, that pipeline architecture isn't meeting the actual consumption need, regardless of whether the data passes every quality check.
Suggested threshold: Defined by consumption SLA, not engineering convenience. Work backward from when stakeholders need the data, then instrument accordingly.
dataset: warehouse/prod/public/fact_orders
checks:
  - freshness:
      name: "Orders must be consumable within 2 hours of landing"
      column: updated_at
      threshold:
        unit: hour
        must_be_less_than: 2
      attributes:
        dimension
Time-to-value is where data quality meets data engineering performance. A dataset can be perfectly accurate and still fail its consumers if it arrives too late. Tracking it as a formal metric, not just an informal SLA, keeps the pipeline optimization conversation grounded in actual business impact.
Data Quality Scorecard Template
A scorecard only works if it's specific enough to act on and simple enough that someone actually maintains it. The table below covers all 12 metrics from this article, with suggested thresholds, check cadence, and ownership assignments you can adapt to your org structure.
Use this as a starting point. The thresholds above are defaults: calibrate them against real pipeline behavior and encode them directly in your contracts. A scorecard in a spreadsheet tells you what you measured. A data contract enforces it.
Metric | Dimension | Formula | Suggested Threshold | Check Frequency | Owner |
|---|---|---|---|---|---|
Completeness Rate | Completeness | (Non-null values / Total values) × 100 | ≥ 98% for key fields; ≥ 95% for descriptive fields | Every pipeline run | Data Engineer |
Validity Rate | Validity | (Valid values / Total values) × 100 | ≥ 99% for join/filter columns; ≥ 95% for freeform fields | Every pipeline run | Data Engineer |
Uniqueness Rate | Uniqueness | ((Total records − Duplicates) / Total records) × 100 | 100% for primary keys; ≥ 99.5% for natural keys | Every pipeline run | Data Engineer |
Freshness | Timeliness | Current timestamp − MAX( | < 1 hr for real-time; < 24 hrs for batch | Continuous / scheduled | Data Engineer |
Accuracy Rate | Accuracy | (Records matching source of truth / Total records) × 100 | ≥ 99% for PII and transactional fields | Daily reconciliation | Data Engineer + Steward |
Consistency Rate | Consistency | (Matching records across systems / Total records) × 100 | ≥ 99% for financial fields; ≥ 97% for operational data | Daily | Data Engineer + Steward |
Data Downtime | Reliability | Incident count × Average (TTD + TTR) | TTD < 1 hr; TTR < 4 hrs; < 8 hrs total/month per dataset | Continuous | Data Engineer + Lead |
Schema Change Rate | Consistency | Unplanned changes / Total schema snapshots | 0 unplanned changes for production tables | Every deployment | Data Architect |
Transformation Failure Rate | Reliability | (Failed jobs / Total jobs) × 100 | < 1% for critical pipelines; < 3% for experimental | Every pipeline run | Data Engineer |
Table Health Score | Composite | Weighted avg of Completeness, Validity, Freshness, Accuracy | ≥ 95 for exec/financial reporting; ≥ 90 for operational | Daily | Data Lead / Governance |
Coverage Rate | Governance | (Datasets with ≥1 check / Total production datasets) × 100 | 100% Tier 1 datasets; ≥ 80% all production datasets | Weekly audit | Data Lead / Architect |
Time-to-Value | Timeliness | BI availability timestamp − Ingestion timestamp | Defined by consumption SLA | Per pipeline run | Data Engineer + Analyst |
A few notes on using this in practice.
Ownership reflects accountability, not authorship. The owner column indicates who is responsible for keeping the metric within threshold, not necessarily who writes the check. Accuracy and Consistency in particular require input from data stewards and domain experts who understand what the source of truth actually is.
Start narrow. If your team is still building out basic coverage, instrument metrics 1 through 4 on every Tier 1 dataset before moving to composite scores and downtime tracking. A scorecard with four well-maintained metrics beats one with twelve that nobody updates.
Treat thresholds as hypotheses. The numbers above are reasonable defaults. The right threshold for your completeness rate depends on what downstream models do with nulls, how often your source system has known gaps, and what your SLA with consumers actually says. Calibrate against real pipeline behavior.
How to Enforce Metrics With Data Contracts
A metric on a dashboard is a report. A metric in a data contract is a gate. One tells you something went wrong after the fact. The other stops bad data from reaching consuming systems in the first place.
Data contracts formalize the implicit agreements between producers and consumers into executable, version-controlled checks.
From Measurement to Enforcement
The contract below covers five core metrics in a single file against dim_product: schema stability, minimum row count, freshness, uniqueness, and validity.
Example Soda Data Contract:
dataset: warehouse/prod/public/dim_product

checks:
  # Enforce schema stability — no unplanned column changes
  - schema:
      name: "Schema must match approved contract"
      allow_extra_columns: false
      allow_other_column_order: false
      attributes:
        dimension: consistency
  # Catch silent truncation before it reaches consumers
  - row_count:
      name: "dim_product must have at least 1000 rows"
      threshold:
        must_be_greater_than: 1000
      attributes:
        dimension: completeness
  # Data must arrive within 24 hours
  - freshness:
      name: "dim_product must refresh within 24 hours"
      column: updated_at
      threshold:
        unit: hour
        must_be_less_than: 24
      attributes:
        dimension: timeliness

columns:
  - name: id
    data_type: varchar
    checks:
      # No duplicate product IDs
      - duplicate:
          name: "Product ID must be unique"
          attributes:
            dimension: uniqueness
  - name: size
    checks:
      # Only approved size values allowed
      - invalid:
          name: "Size must be S, M, or L"
          valid_values: ['S', 'M', 'L']
          threshold:
            metric: percent
            must_be_less_than: 1
          attributes:
            dimension
Five metrics. One contract. One gate.
See more example data contracts in out Templates gallery.
What a Contract Failure Actually Looks Like
A retail team running a nightly product catalog update hit a contract failure when Soda detected future-dated production_date values in an incoming supplier feed. Records were timestamped months ahead of the current date due to a formatting error in the upstream system.
The contract blocked the catalog update and surfaced the failed rows for review. Without it, those records would have propagated into inventory forecasting models and corrupted replenishment calculations for the affected SKUs.
The fix took 20 minutes. Undetected, that problem would have taken days to trace.
Scaling Contract Coverage
Past a certain point, maintaining contracts by hand creates its own coverage problem.
Contract Autopilot generates and maintains checks based on observed data behavior, so coverage grows with your infrastructure.
Contracts Copilot lets you describe a check in plain English and generates the corresponding contract language, removing the syntax barrier for non-engineering stakeholders.
Both tools address the same root cause: data quality programs stall at partial coverage because manual contract writing is slow and inaccessible. Contracts should be a default part of how pipelines ship, not a backlog item.
From Metrics to Observability
The 12 metrics in this article share a common assumption: you already know what to measure. You define the rule, set the threshold, and write the check. That works well for failures you can anticipate.
Threshold checks won't catch a slow drift. Your avg_order_value can slide 15% over two weeks with every daily check returning green while your revenue model runs on stale data. Regional null rates can rise gradually instead of spiking. Distributions can shift in ways no existing check was designed to catch. These aren't edge cases. They're the issues that dominate most production investigations.
That's where data observability takes over. Instead of enforcing predefined rules, it learns the normal behavior of your data over time and flags statistically significant deviations. No thresholds to configure upfront. No rules to write before patterns emerge.
Soda's ML-powered anomaly detection identifies behavioral drift with 70% fewer false positives than conventional monitoring and scales across datasets of up to 1 billion rows. That reduction in noise matters because alert fatigue is itself a reliability problem.
Data contracts and observability are complementary by design.
Contracts enforce the rules you can clearly define. Data observability surfaces the problems you couldn't have written a rule for yet.
Checks catch failures. Contracts prevent them. Observability covers what neither can see on its own.
Start instrumenting these metrics today.
Run your first contract check in under 30 minutes — Soda Core is open source, no vendor setup required
Explore the Soda contract language reference — full syntax, check types, and threshold operators
Join the Soda community — 5,000+ data engineers sharing checks, patterns, and pipeline fixes
Frequently Asked Questions
Your completeness check passed. Your null rate looks clean. Your row count is within range. And somewhere downstream, a dbt model just silently returned wrong numbers because a column your pipeline depends on started arriving empty two hours ago.
This is what happens when you track the wrong metrics. Many teams instrument what's easy to query, not what reflects actual pipeline health. And the gap between the two only shows up when a consumer notices something broken.
A quick distinction worth making before diving in:
Data quality dimensions are qualitative properties your data should have: accuracy, completeness, timeliness, etc
Data quality metrics quantify those properties into measurable, alertable numbers
Data quality KPIs tie metrics to business targets, the thresholds that actually matter to stakeholders
The 12 data quality metrics below are designed to get you to KPIs, with practical examples and Soda contract language you can apply directly in your pipelines. Each code block is a YAML check: define it against a named dataset, run soda scan, and Soda alerts your team or blocks the pipeline on failure, depending on how you've configured enforcement.
6 Core Data Quality Metrics
Incomplete, invalid, or duplicate data causes pipeline failures across production environments. Nearly 97% of senior data leaders report that data integration failures have slowed their analytics or AI programs (Fivetran, 2026). Yet most teams discover issues from consumer complaints rather than automated checks.
The six metrics below are the ones that belong in every data quality program, regardless of stack or scale. They are specific enough to alert on, trend over time, and report against SLAs.
1. Completeness Rate
Definition: The percentage of required fields that contain non-null, non-empty values.
Formula: (Non-null values / Total values) × 100
Worked example: Your dim_customer table has 50,000 rows. The last_name column contains 4,250 nulls. Completeness rate = ((50,000 − 4,250) / 50,000) × 100 = 91.5%. If your SLA requires 98%, this is a failing pipeline.
Suggested threshold: ≥ 98% for primary and foreign key columns; ≥ 95% for non-critical descriptive fields.
dataset: warehouse/prod/public/dim_customer
columns:
  - name: last_name
    checks:
      - missing:
          name: "Last name completeness must exceed 98%"
          threshold:
            metric: percent
            must_be_less_than: 2
          attributes:
            dimension
Running this check gates your pipeline before last_name nulls reach any dependent model that relies on it for customer segmentation or identity resolution.
2. Validity Rate
Definition: The percentage of values that conform to a defined set of allowed values, formats, or ranges.
Formula: (Valid values / Total values) × 100
Worked example: Your dim_product table has 12,000 rows. The size column should only contain S, M, or L. You find 360 rows with values like XL, small, or null. Validity rate = ((12,000 − 360) / 12,000) × 100 = 97%. Anything outside the allowed set will break filtering logic in your reporting layer.
Suggested threshold: ≥ 99% for columns used in joins or filters; ≥ 95% for freeform descriptive columns.
dataset: warehouse/prod/public/dim_product
columns:
  - name: size
    checks:
      - invalid:
          name: "Size must be S, M, or L only"
          valid_values: ['S', 'M', 'L']
          threshold:
            metric: percent
            must_be_less_than: 1
          attributes:
            dimension
Validity checks are where domain knowledge earns its place in contract language. The engineering team can write the check, but the allowed value set should be agreed on with data consumers before it ships.
3. Uniqueness Rate
Definition: The percentage of records that are free from duplication across a column or combination of columns that should be unique.
Formula: ((Total records − Duplicate records) / Total records) × 100
Worked example: Your dim_product table contains 12,000 rows. A duplicate check on the id column surfaces 240 repeated values. Uniqueness rate = ((12,000 − 240) / 12,000) × 100 = 98%. Those 240 duplicates will cause fan-out in any join that depends on this column, silently inflating metrics.
Suggested threshold: 100% for primary keys and surrogate keys; ≥ 99.5% for natural keys with known edge cases.
dataset: warehouse/prod/public/dim_product
columns:
  - name: id
    data_type: varchar
    checks:
      - duplicate:
          name: "Product ID must be unique"
          attributes:
            dimension
For composite keys (for example, customer_id and order_date), move the check to the dataset level and pass both columns explicitly.
4. Freshness
Definition: The time elapsed since the most recent record was written to a dataset, measured against a defined SLA.
Formula: Current timestamp − MAX(updated_at)
Worked example: Your pipeline is expected to land data every hour. At 14:00, you query MAX(updated_at) and get 11:45. Lag = 2 hours 15 minutes, breaching a 2-hour SLA. A dashboard refreshing at 14:00 is now serving 2+ hour-old data with no visible indication to the consumer.
Suggested threshold: Depends entirely on consumption context. Real-time dashboards typically need < 1 hour; batch analytical models can tolerate < 24 hours.
dataset: warehouse/prod/public/fact_orders
checks:
  - freshness:
      name: "Orders table must refresh within 24 hours"
      column: updated_at
      threshold:
        unit: hour
        must_be_less_than: 24
      attributes:
        dimension
Freshness is one of the highest-signal metrics for operational pipelines precisely because it fails visibly and fast. A stale table is often the first symptom of a broken upstream dependency.
5. Accuracy Rate
Definition: The percentage of records that match a verified, authoritative source of truth, one where correctness is externally established.
Formula: (Records matching source of truth / Total records) × 100
Worked example: You pull 10,000 customer records from your warehouse and reconcile them against your CRM export. 312 records have mismatched email values. Accuracy rate = ((10,000 − 312) / 10,000) × 100 = 96.88%. Those 312 records will generate failed lookups in any campaign tool consuming the warehouse.
Suggested threshold: ≥ 99% for PII and transactional fields; ≥ 97% for enrichment data with known lag.
dataset: warehouse/prod/public/dim_customer
checks:
  - metric:
      name: "CRM reconciliation: email mismatches must be below 1%"
      query: |
        SELECT COUNT(*) FROM dim_customer dc
        LEFT JOIN crm_export ce ON dc.customer_id = ce.customer_id
        WHERE dc.email != ce.email
        AND ce.customer_id IS NOT NULL
      threshold:
        must_be_less_than: 100
      attributes:
        dimension
Accuracy requires a reference point. Without a source of truth to reconcile against, what looks like an accuracy check is usually a validity check in disguise.
6. Consistency Rate
Definition: The percentage of records that match across two peer systems where neither is the source of truth, but both are expected to represent the same underlying reality.
Formula: (Matching records across systems / Total records) × 100
Worked example: Your warehouse holds product prices ingested from an internal pricing service. Your BI layer pulls prices from the same pricing service via API at query time. Comparing 8,000 records, you find 560 with price discrepancies greater than $0.05. Consistency rate = ((8,000 − 560) / 8,000) × 100 = 93%. Neither system is wrong by design, but they disagree, and that disagreement will surface as conflicting numbers in different reports.
Suggested threshold: ≥ 99% for financial and transactional fields; ≥ 97% for operational data with known sync delays.
dataset: warehouse/prod/public/dim_product
checks:
  - metric:
      name: "Price consistency: warehouse vs API must agree within $0.05"
      query: |
        SELECT COUNT(*) FROM dim_product dp
        JOIN api_pricing_snapshot aps
        ON dp.product_id = aps.product_id
        WHERE ABS(dp.price - aps.price) > 0.05
      threshold:
        must_be: 0
      attributes:
        dimension
The practical difference between accuracy and consistency matters when you're triaging an incident. Accuracy failures point you toward a data engineering problem: something went wrong in ingestion or transformation. Consistency failures point you toward a systems alignment problem: two sources that should agree have drifted, and you need to understand why before deciding which one to trust.
Try it on your own data. Soda Core is open source — run your first contract check against a production dataset in under 30 minutes. No vendor setup required.
6 Advanced Data Quality Metrics
The checks above catch known violations. They don't catch operational failures such as pipeline downtime, schema drift, or coverage gaps that leave entire datasets unmonitored. These six advanced data quality metrics measure the health of your quality program itself, not just the data it monitors.
7. Data Downtime
Definition: The total time during which a dataset was unavailable, incomplete, or known to be erroneous, measured from incident detection to resolution.
Formula: Data Downtime = Incident count × Average (TTD + TTR)
Three sub-metrics drive this number:
Incident count: How many data quality failures occurred in a given period
Time-to-detect (TTD): How long between a failure occurring and your team knowing about it
Time-to-resolve (TTR): How long from detection to the dataset being trustworthy again
Worked example: In a 30-day period, your team logs 4 incidents. Average TTD is 3 hours, average TTR is 5 hours. Total data downtime = 4 × (3 + 5) = 32 hours. For a pipeline feeding a real-time sales dashboard, 32 hours of monthly downtime is a significant reliability problem, even if no single incident lasted more than a day.
Suggested threshold: TTD < 1 hour for critical pipelines; TTR < 4 hours; total monthly downtime < 8 hours per critical dataset.
dataset: warehouse/prod/public/fact_orders
checks:
  - freshness:
      name: "Downtime signal: orders table stale beyond 1-hour SLA"
      column: updated_at
      threshold:
        unit: hour
        must_be_less_than: 1
      attributes:
        dimension: timeliness
  - row_count:
      name: "Downtime signal: orders table empty or truncated"
      threshold:
        must_be_greater_than: 0
      attributes:
        dimension
Each failed check opens an incident in Soda Cloud. TTD is the time between the failure timestamp and the alert notification. TTR is the time between incident creation and resolution. The downtime formula runs on top of those incident records, not inside the check itself.
Reducing TTD is usually higher leverage than reducing TTR. Faster detection shortens every incident automatically, regardless of how complex the fix turns out to be.
8. Schema Change Rate
Definition: The number of unplanned schema changes, including added, removed, or retyped columns, occurring in a dataset over a defined period.
Formula: Unplanned schema changes / Total observed schema snapshots
Worked example: Over 90 days, your fact_orders table undergoes 11 schema snapshots. Three surface unplanned changes: a column renamed from cust_id to customer_id, a VARCHAR field silently cast to TEXT, and a column dropped without notice. Schema change rate = 3/11 = 27%. Each of those changes had the potential to silently break a dependent dbt model.
Suggested threshold: 0 unplanned changes per period for production tables with downstream dependencies. Gate every schema change through a contract check before it reaches production.
dataset: warehouse/prod/public/fact_orders
checks:
  - schema:
      name: "No unplanned schema changes on fact_orders"
      allow_extra_columns: false
      allow_other_column_order: false
      attributes:
        dimension
Schema drift is one of the most common sources of silent pipeline failures. A column rename in a source system doesn't throw an error. It just starts returning nulls in consuming models, and your completeness check catches it hours later after the damage is done. Locking schema with a contract check means the failure surfaces at the gate, not in production.
9. Transformation Failure Rate
Definition: The percentage of pipeline job runs that fail during transformation, covering dbt model errors, Spark job failures, and any processing step between raw ingestion and the serving layer.
Formula: (Failed transformation jobs / Total transformation jobs) × 100
Worked example: Over 30 days, your orchestration layer logs 840 transformation job runs. 42 fail, mostly due to upstream schema changes and type casting errors. Transformation failure rate = (42 / 840) × 100 = 5%. On a pipeline running 28 times per day, that's roughly 1.4 failures per day, enough to make your data reliability story uncomfortable in a stakeholder review.
Suggested threshold: < 1% for critical production pipelines; < 3% for experimental or early-stage pipelines.
dataset: warehouse/prod/public/fact_orders
checks:
  - metric:
      name: "Transformation failure proxy: negative amounts must be zero"
      query: |
        SELECT COUNT(*) FROM fact_orders
        WHERE amount < 0
      threshold:
        must_be: 0
      attributes:
        dimension
You won't always catch transformation failures with a single check. Instrumenting known failure signatures, like negative amounts or impossible date ranges, gives you a proxy metric that trends alongside your job failure rate.
10. Table Health Score
Definition: A weighted composite score that aggregates multiple data quality metrics into a single number representing the overall trustworthiness of a dataset.
Formula: Health Score = (w₁ × Completeness) + (w₂ × Validity) + (w₃ × Freshness) + (w₄ × Accuracy)
Weights should reflect the consumption context. A financial reporting table weights accuracy heavily. A marketing segmentation table might weight freshness and completeness more.
Worked example: For dim_customer, you assign equal weights of 0.25 to each dimension. Scores from your last pipeline run: Completeness = 96%, Validity = 99%, Freshness = 100% (within SLA), Accuracy = 94%. Health score = (0.25 × 96) + (0.25 × 99) + (0.25 × 100) + (0.25 × 94) = 97.25 / 100.
Suggested threshold: ≥ 95 for datasets powering executive dashboards or financial reporting; ≥ 90 for operational datasets; flag anything below 85 for immediate review.
Soda calculates this from your check results automatically. The formula above shows the underlying logic, useful if you're building your own composite in custom reporting.
The health score is most useful as a communication tool: a single number stakeholders can anchor trust conversations around without interpreting five separate metric trends. In Soda Cloud, it's surfaced in the dataset dashboard and rolled up across all monitored datasets in the organization dashboard (see image bellow).
Checks tab with checks filters - Health score at 50%
5. Coverage Rate
Definition: The percentage of production datasets that have at least one automated data quality check running against them.
Formula: (Datasets with ≥1 active check / Total production datasets) × 100
Worked example: Your warehouse has 214 production tables. Your team has instrumented checks on 129 of them. Coverage rate = (129 / 214) × 100 = 60.3%. The remaining 40% are running without any quality gate, which means any upstream change, schema drift, or ingestion failure in those tables will only surface when a consumer notices something wrong.
Suggested threshold: 100% coverage on Tier 1 datasets feeding dashboards, ML models, or financial reporting; ≥ 80% across all production datasets.
Scaling coverage manually doesn't work past a certain point. Soda's Contract Autopilot automates contract lifecycle management, generating and maintaining checks across datasets so coverage grows with your infrastructure rather than lagging behind it.
6. Time-to-Value
Definition: The total lag between data landing in your ingestion layer and that data being available and trustworthy in your BI or serving layer.
Formula: Time-to-Value = BI availability timestamp − Ingestion timestamp
Worked example: Raw order events land in your data lake at 08:00. They pass through three transformation stages, a quality gate, and a materialization step before surfacing in your reporting layer at 11:45. Time-to-value = 3 hours 45 minutes. If your sales team expects morning numbers before their 09:30 standup, that pipeline architecture isn't meeting the actual consumption need, regardless of whether the data passes every quality check.
Suggested threshold: Defined by consumption SLA, not engineering convenience. Work backward from when stakeholders need the data, then instrument accordingly.
dataset: warehouse/prod/public/fact_orders
checks:
  - freshness:
      name: "Orders must be consumable within 2 hours of landing"
      column: updated_at
      threshold:
        unit: hour
        must_be_less_than: 2
      attributes:
        dimension
Time-to-value is where data quality meets data engineering performance. A dataset can be perfectly accurate and still fail its consumers if it arrives too late. Tracking it as a formal metric, not just an informal SLA, keeps the pipeline optimization conversation grounded in actual business impact.
Data Quality Scorecard Template
A scorecard only works if it's specific enough to act on and simple enough that someone actually maintains it. The table below covers all 12 metrics from this article, with suggested thresholds, check cadence, and ownership assignments you can adapt to your org structure.
Use this as a starting point. The thresholds above are defaults: calibrate them against real pipeline behavior and encode them directly in your contracts. A scorecard in a spreadsheet tells you what you measured. A data contract enforces it.
Metric | Dimension | Formula | Suggested Threshold | Check Frequency | Owner |
|---|---|---|---|---|---|
Completeness Rate | Completeness | (Non-null values / Total values) × 100 | ≥ 98% for key fields; ≥ 95% for descriptive fields | Every pipeline run | Data Engineer |
Validity Rate | Validity | (Valid values / Total values) × 100 | ≥ 99% for join/filter columns; ≥ 95% for freeform fields | Every pipeline run | Data Engineer |
Uniqueness Rate | Uniqueness | ((Total records − Duplicates) / Total records) × 100 | 100% for primary keys; ≥ 99.5% for natural keys | Every pipeline run | Data Engineer |
Freshness | Timeliness | Current timestamp − MAX( | < 1 hr for real-time; < 24 hrs for batch | Continuous / scheduled | Data Engineer |
Accuracy Rate | Accuracy | (Records matching source of truth / Total records) × 100 | ≥ 99% for PII and transactional fields | Daily reconciliation | Data Engineer + Steward |
Consistency Rate | Consistency | (Matching records across systems / Total records) × 100 | ≥ 99% for financial fields; ≥ 97% for operational data | Daily | Data Engineer + Steward |
Data Downtime | Reliability | Incident count × Average (TTD + TTR) | TTD < 1 hr; TTR < 4 hrs; < 8 hrs total/month per dataset | Continuous | Data Engineer + Lead |
Schema Change Rate | Consistency | Unplanned changes / Total schema snapshots | 0 unplanned changes for production tables | Every deployment | Data Architect |
Transformation Failure Rate | Reliability | (Failed jobs / Total jobs) × 100 | < 1% for critical pipelines; < 3% for experimental | Every pipeline run | Data Engineer |
Table Health Score | Composite | Weighted avg of Completeness, Validity, Freshness, Accuracy | ≥ 95 for exec/financial reporting; ≥ 90 for operational | Daily | Data Lead / Governance |
Coverage Rate | Governance | (Datasets with ≥1 check / Total production datasets) × 100 | 100% Tier 1 datasets; ≥ 80% all production datasets | Weekly audit | Data Lead / Architect |
Time-to-Value | Timeliness | BI availability timestamp − Ingestion timestamp | Defined by consumption SLA | Per pipeline run | Data Engineer + Analyst |
A few notes on using this in practice.
Ownership reflects accountability, not authorship. The owner column indicates who is responsible for keeping the metric within threshold, not necessarily who writes the check. Accuracy and Consistency in particular require input from data stewards and domain experts who understand what the source of truth actually is.
Start narrow. If your team is still building out basic coverage, instrument metrics 1 through 4 on every Tier 1 dataset before moving to composite scores and downtime tracking. A scorecard with four well-maintained metrics beats one with twelve that nobody updates.
Treat thresholds as hypotheses. The numbers above are reasonable defaults. The right threshold for your completeness rate depends on what downstream models do with nulls, how often your source system has known gaps, and what your SLA with consumers actually says. Calibrate against real pipeline behavior.
How to Enforce Metrics With Data Contracts
A metric on a dashboard is a report. A metric in a data contract is a gate. One tells you something went wrong after the fact. The other stops bad data from reaching consuming systems in the first place.
Data contracts formalize the implicit agreements between producers and consumers into executable, version-controlled checks.
From Measurement to Enforcement
The contract below covers five core metrics in a single file against dim_product: schema stability, minimum row count, freshness, uniqueness, and validity.
Example Soda Data Contract:
dataset: warehouse/prod/public/dim_product

checks:
  # Enforce schema stability — no unplanned column changes
  - schema:
      name: "Schema must match approved contract"
      allow_extra_columns: false
      allow_other_column_order: false
      attributes:
        dimension: consistency
  # Catch silent truncation before it reaches consumers
  - row_count:
      name: "dim_product must have at least 1000 rows"
      threshold:
        must_be_greater_than: 1000
      attributes:
        dimension: completeness
  # Data must arrive within 24 hours
  - freshness:
      name: "dim_product must refresh within 24 hours"
      column: updated_at
      threshold:
        unit: hour
        must_be_less_than: 24
      attributes:
        dimension: timeliness

columns:
  - name: id
    data_type: varchar
    checks:
      # No duplicate product IDs
      - duplicate:
          name: "Product ID must be unique"
          attributes:
            dimension: uniqueness
  - name: size
    checks:
      # Only approved size values allowed
      - invalid:
          name: "Size must be S, M, or L"
          valid_values: ['S', 'M', 'L']
          threshold:
            metric: percent
            must_be_less_than: 1
          attributes:
            dimension
Five metrics. One contract. One gate.
See more example data contracts in out Templates gallery.
What a Contract Failure Actually Looks Like
A retail team running a nightly product catalog update hit a contract failure when Soda detected future-dated production_date values in an incoming supplier feed. Records were timestamped months ahead of the current date due to a formatting error in the upstream system.
The contract blocked the catalog update and surfaced the failed rows for review. Without it, those records would have propagated into inventory forecasting models and corrupted replenishment calculations for the affected SKUs.
The fix took 20 minutes. Undetected, that problem would have taken days to trace.
Scaling Contract Coverage
Past a certain point, maintaining contracts by hand creates its own coverage problem.
Contract Autopilot generates and maintains checks based on observed data behavior, so coverage grows with your infrastructure.
Contracts Copilot lets you describe a check in plain English and generates the corresponding contract language, removing the syntax barrier for non-engineering stakeholders.
Both tools address the same root cause: data quality programs stall at partial coverage because manual contract writing is slow and inaccessible. Contracts should be a default part of how pipelines ship, not a backlog item.
From Metrics to Observability
The 12 metrics in this article share a common assumption: you already know what to measure. You define the rule, set the threshold, and write the check. That works well for failures you can anticipate.
Threshold checks won't catch a slow drift. Your avg_order_value can slide 15% over two weeks with every daily check returning green while your revenue model runs on stale data. Regional null rates can rise gradually instead of spiking. Distributions can shift in ways no existing check was designed to catch. These aren't edge cases. They're the issues that dominate most production investigations.
That's where data observability takes over. Instead of enforcing predefined rules, it learns the normal behavior of your data over time and flags statistically significant deviations. No thresholds to configure upfront. No rules to write before patterns emerge.
Soda's ML-powered anomaly detection identifies behavioral drift with 70% fewer false positives than conventional monitoring and scales across datasets of up to 1 billion rows. That reduction in noise matters because alert fatigue is itself a reliability problem.
Data contracts and observability are complementary by design.
Contracts enforce the rules you can clearly define. Data observability surfaces the problems you couldn't have written a rule for yet.
Checks catch failures. Contracts prevent them. Observability covers what neither can see on its own.
Start instrumenting these metrics today.
Run your first contract check in under 30 minutes — Soda Core is open source, no vendor setup required
Explore the Soda contract language reference — full syntax, check types, and threshold operators
Join the Soda community — 5,000+ data engineers sharing checks, patterns, and pipeline fixes
Frequently Asked Questions
What is the difference between data quality metrics and data quality dimensions?
Dimensions are qualitative categories (completeness, accuracy, timeliness) that describe properties your data should have. Metrics quantify them into numbers you can alert on. Completeness is a dimension. "97.3% of customer_email values are non-null in the last pipeline run" is a metric. Dimensions guide strategy. Metrics are what you monitor and tie to SLAs.
How do you measure data quality?
Start by identifying which dimensions matter for the dataset and its consumers. Define a metric for each (the formula or query that produces a number), set a threshold, automate the check, and track results over time. For most teams, completeness, validity, and freshness on Tier 1 datasets is the right starting point.
What are the most important data quality KPIs?
It depends on what your data powers, but three consistently show up as high-signal. Freshness lag catches pipelines that pass every check but arrive too late. Null rate on primary keys is the most reliable early indicator of ingestion failures. Data downtime per dataset gives leadership a single reliability number without interpreting individual check results.
How often should you measure data quality metrics?
Match check frequency to pipeline cadence and consumption sensitivity. Critical pipelines should run checks at every execution before data is promoted to the serving layer. Freshness checks warrant continuous monitoring; schema checks run on every deployment. If your checks are too slow to run that frequently, that is the problem worth solving first.
Trusted by the world’s leading enterprises
Real stories from companies using Soda to keep their data reliable, accurate, and ready for action.
At the end of the day, we don’t want to be in there managing the checks, updating the checks, adding the checks. We just want to go and observe what’s happening, and that’s what Soda is enabling right now.

Sid Srivastava
Director of Data Governance, Quality and MLOps
Investing in data quality is key for cross-functional teams to make accurate, complete decisions with fewer risks and greater returns, using initiatives such as product thinking, data governance, and self-service platforms.

Mario Konschake
Director of Product-Data Platform
Soda has integrated seamlessly into our technology stack and given us the confidence to find, analyze, implement, and resolve data issues through a simple self-serve capability.

Sutaraj Dutta
Data Engineering Manager
Our goal was to deliver high-quality datasets in near real-time, ensuring dashboards reflect live data as it flows in. But beyond solving technical challenges, we wanted to spark a cultural shift - empowering the entire organization to make decisions grounded in accurate, timely data.

Gu Xie
Head of Data Engineering
4,4 sur 5
Commencez à faire confiance à vos données. Aujourd'hui.
Trouvez, comprenez et corrigez tout problème de qualité des données en quelques secondes.
Du niveau de la table au niveau des enregistrements.
Adopté par
Product


Trusted by the world’s leading enterprises
Real stories from companies using Soda to keep their data reliable, accurate, and ready for action.
At the end of the day, we don’t want to be in there managing the checks, updating the checks, adding the checks. We just want to go and observe what’s happening, and that’s what Soda is enabling right now.
Sid Srivastava
Director of Data Governance, Quality and MLOps
Investing in data quality is key for cross-functional teams to make accurate, complete decisions with fewer risks and greater returns, using initiatives such as product thinking, data governance, and self-service platforms.
Mario Konschake
Director of Product-Data Platform
Soda has integrated seamlessly into our technology stack and given us the confidence to find, analyze, implement, and resolve data issues through a simple self-serve capability.
Sutaraj Dutta
Data Engineering Manager
Our goal was to deliver high-quality datasets in near real-time, ensuring dashboards reflect live data as it flows in. But beyond solving technical challenges, we wanted to spark a cultural shift - empowering the entire organization to make decisions grounded in accurate, timely data.
Gu Xie
Head of Data Engineering
4,4 sur 5
Commencez à faire confiance à vos données. Aujourd'hui.
Trouvez, comprenez et corrigez tout problème de qualité des données en quelques secondes.
Du niveau de la table au niveau des enregistrements.
Adopté par
Product
Solutions
Company